Fig. 18.
Download original image
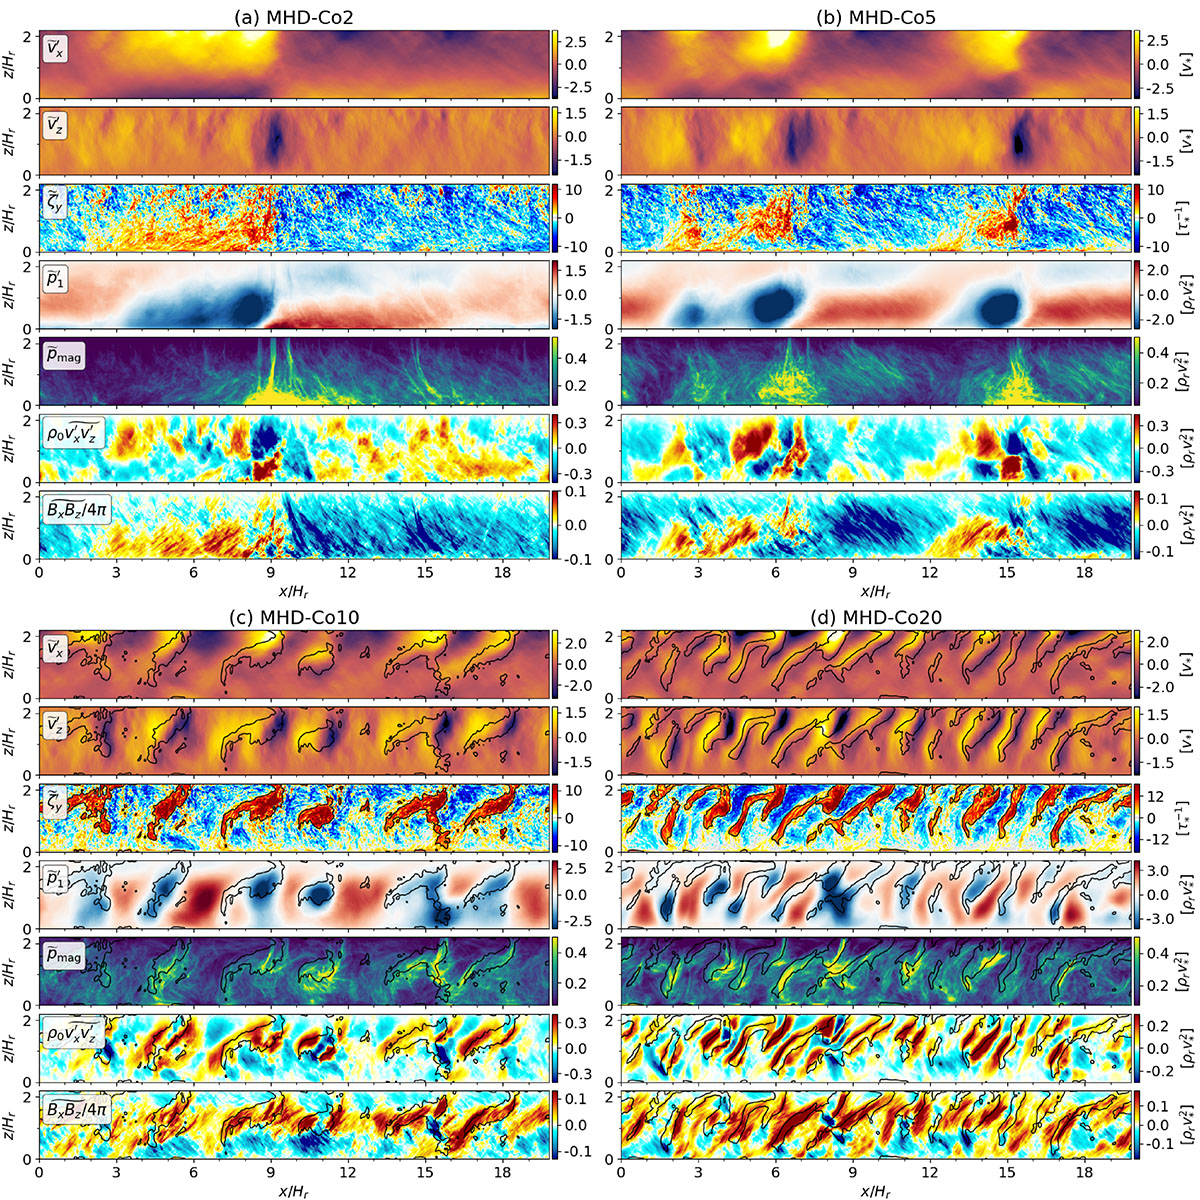
Snapshots of the y-averaged quantities from MHD simulations with Co* = 2, 5, 10, and 20. Each panel, from top to bottom, displays the y-averaged profiles of the x velocity, ![]() , z velocity,
, z velocity, ![]() , y vorticity,
, y vorticity, ![]() , pressure perturbation,
, pressure perturbation, ![]() , magnetic energy density,
, magnetic energy density, ![]() , velocity correlation,
, velocity correlation, ![]() , and magnetic field correlation,
, and magnetic field correlation, ![]() . In rapidly rotating cases MHD-Co10 and MHD-Co20 (panels c–d), black curves indicate contour lines of the y vorticity at
. In rapidly rotating cases MHD-Co10 and MHD-Co20 (panels c–d), black curves indicate contour lines of the y vorticity at ![]() .
.
Current usage metrics show cumulative count of Article Views (full-text article views including HTML views, PDF and ePub downloads, according to the available data) and Abstracts Views on Vision4Press platform.
Data correspond to usage on the plateform after 2015. The current usage metrics is available 48-96 hours after online publication and is updated daily on week days.
Initial download of the metrics may take a while.