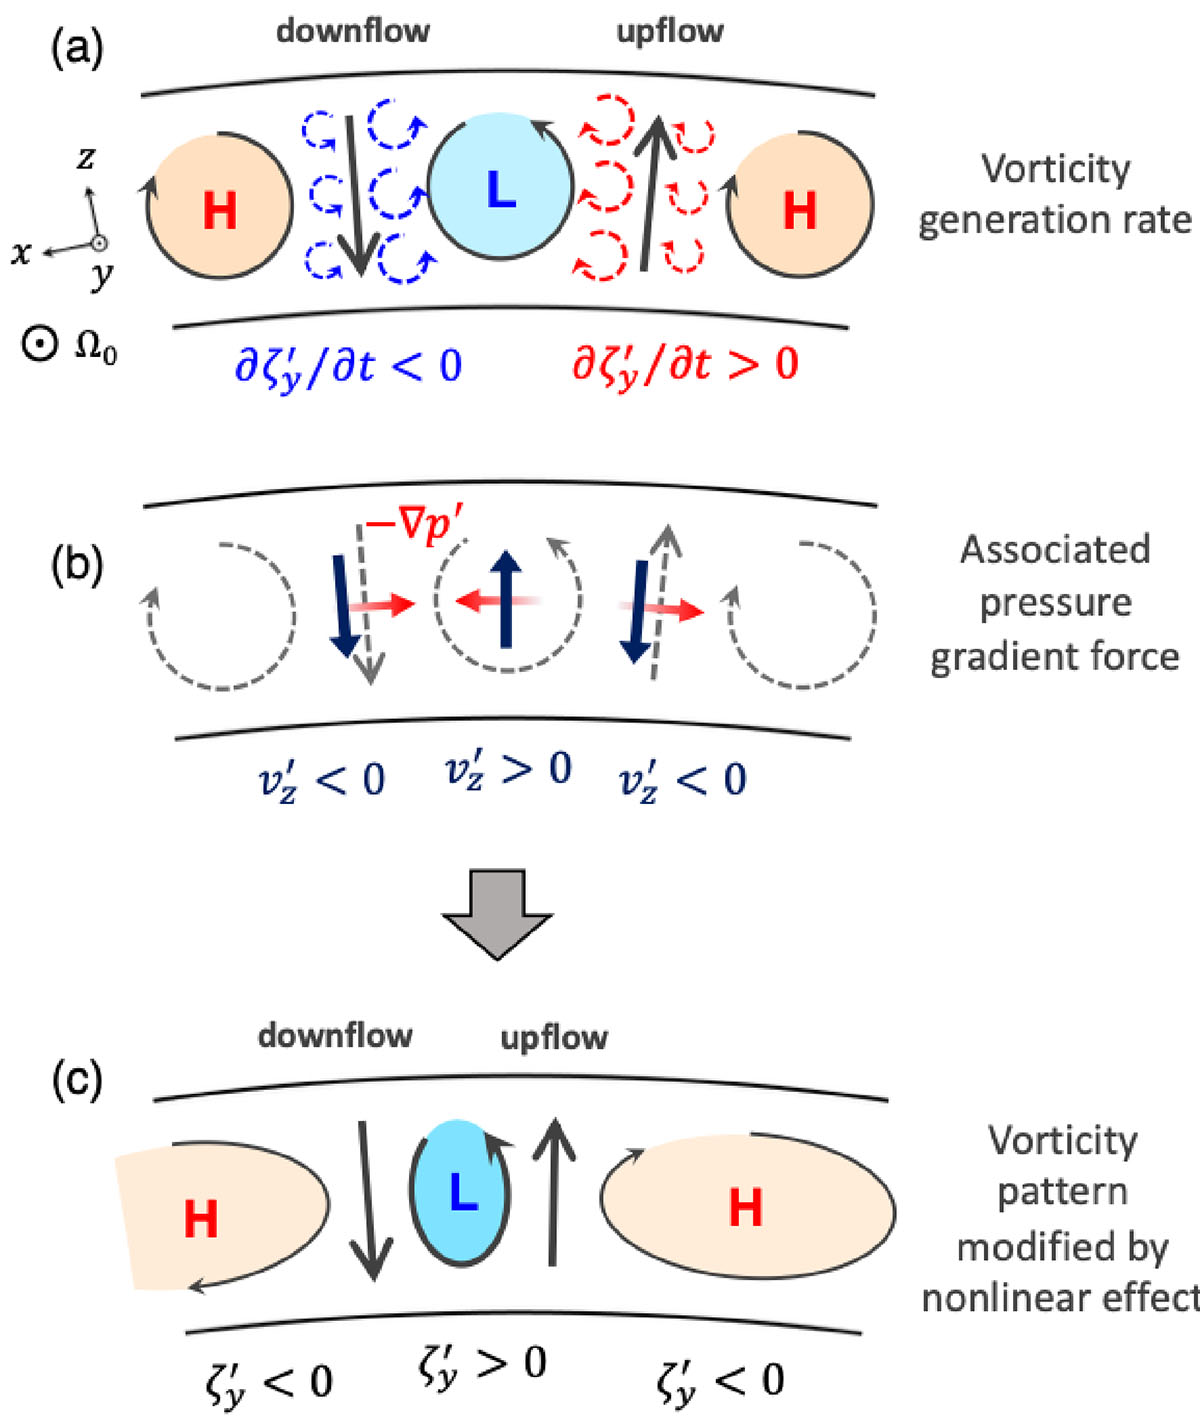
Fig. E.1.
Download original image
Schematic illustration explaining the origin of the asymmetry between counterclockwise and clockwise y vortices. (a) Vorticity generation rates in upflow and downflow regions. Red and blue dashed circles with arrows indicate the generations of negative and positive y vortices (corresponding to higher and lower pressure perturbations). The vorticity generation is stronger (represented by larger circle size) inside the low-pressure column with ζy′> 0 due to the nonlinear effect. (b) Directions of the pressure gradient forces (red arrows) and the flows required to balance these pressure gradient forces by their Coriolis forces (black arrows). (c) Spatial pattern of the y vortices modified by the nonlinear effect. In all panels, the rotational axis points toward us.
Current usage metrics show cumulative count of Article Views (full-text article views including HTML views, PDF and ePub downloads, according to the available data) and Abstracts Views on Vision4Press platform.
Data correspond to usage on the plateform after 2015. The current usage metrics is available 48-96 hours after online publication and is updated daily on week days.
Initial download of the metrics may take a while.