Fig. 9.
Download original image
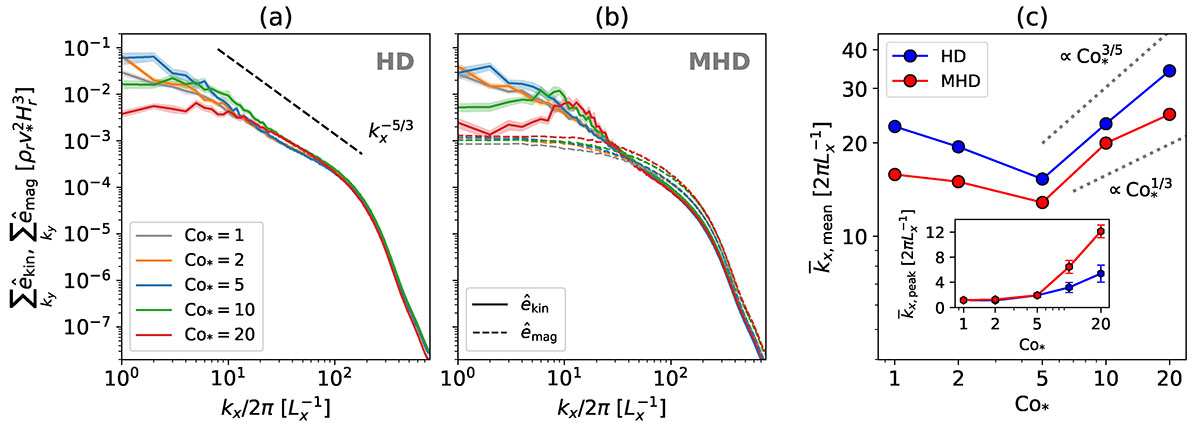
(a) Kinetic energy spectra, ![]() , as functions of longitudinal wavenumber kx in the middle convection zone (z = 1.1 Hr) for HD cases. Different colors correspond to different Co*. The dotted black line shows a
, as functions of longitudinal wavenumber kx in the middle convection zone (z = 1.1 Hr) for HD cases. Different colors correspond to different Co*. The dotted black line shows a ![]() power law. (b) Same kinetic energy spectra as panel (a) but for MHD cases. Dotted curves show the magnetic energy spectra,
power law. (b) Same kinetic energy spectra as panel (a) but for MHD cases. Dotted curves show the magnetic energy spectra, ![]() , at the same depth. (c) Mean wavenumber,
, at the same depth. (c) Mean wavenumber, ![]() , defined by Eq. (29) as functions of Co*. The blue and red colors correspond to the HD and MHD cases, respectively. The dotted gray lines show
, defined by Eq. (29) as functions of Co*. The blue and red colors correspond to the HD and MHD cases, respectively. The dotted gray lines show ![]() and
and ![]() dependences theoretically expected from the CIA and MAC balances. The inset shows the wavenumbers where the kinetic energy spectra peak,
dependences theoretically expected from the CIA and MAC balances. The inset shows the wavenumbers where the kinetic energy spectra peak, ![]() .
.
Current usage metrics show cumulative count of Article Views (full-text article views including HTML views, PDF and ePub downloads, according to the available data) and Abstracts Views on Vision4Press platform.
Data correspond to usage on the plateform after 2015. The current usage metrics is available 48-96 hours after online publication and is updated daily on week days.
Initial download of the metrics may take a while.