Fig. 1
Download original image
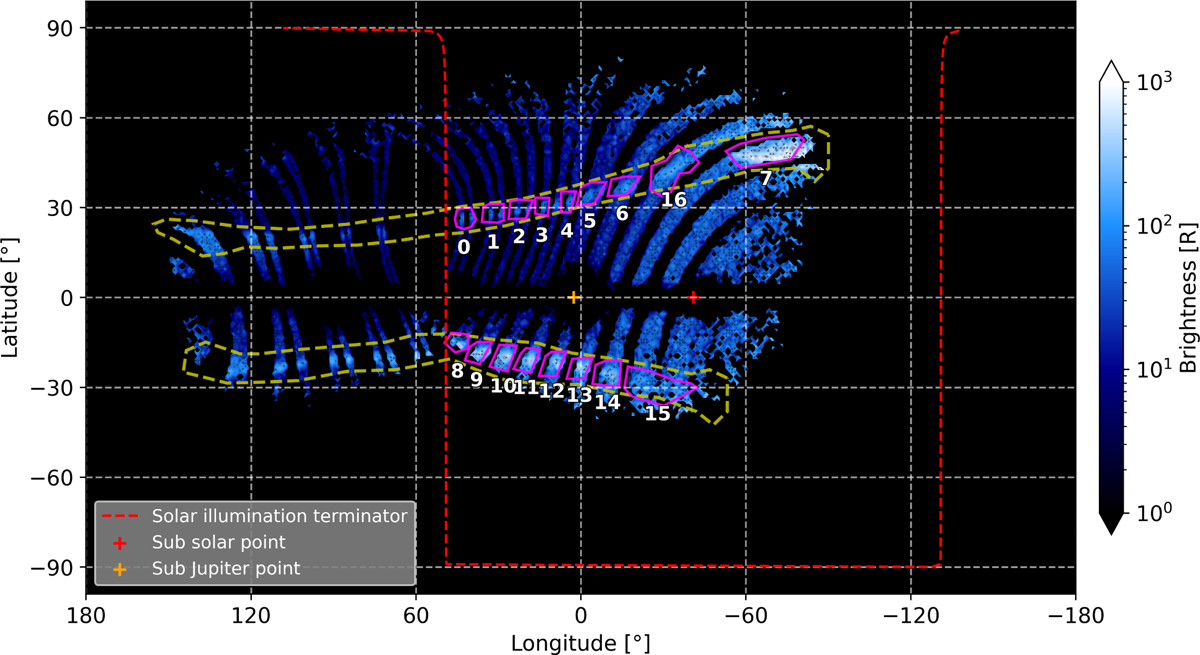
Total brightness map of the atomic oxygen auroral emission lines around 130.4 and 135.6 nm observed during Juno’s PJ34 flyby of Ganymede. The yellow polygons (dashed lines) indicate the main auroral regions identified from the observations. The colored polygons (solid lines), magenta polygons numbered from 0 to 16, delineate the specific subregions investigated in this study.
Current usage metrics show cumulative count of Article Views (full-text article views including HTML views, PDF and ePub downloads, according to the available data) and Abstracts Views on Vision4Press platform.
Data correspond to usage on the plateform after 2015. The current usage metrics is available 48-96 hours after online publication and is updated daily on week days.
Initial download of the metrics may take a while.