Open Access
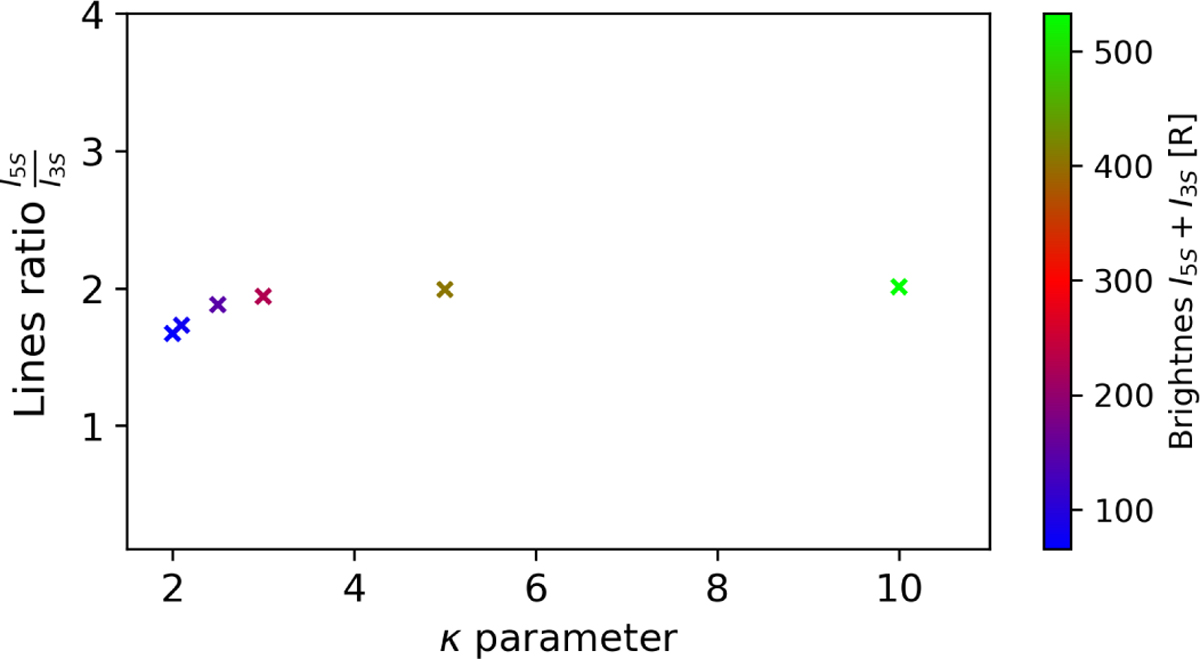
Fig. D.4
Download original image
Line ratio I(135.6 nm)/I(130.4 nm) as a function of the κ parameter applied to the kappa distribution in the TransPlanet model for the fitting case of region 10. The color intensity represents the evolution of the total brightness of the modeled oxygen spectral lines.
Current usage metrics show cumulative count of Article Views (full-text article views including HTML views, PDF and ePub downloads, according to the available data) and Abstracts Views on Vision4Press platform.
Data correspond to usage on the plateform after 2015. The current usage metrics is available 48-96 hours after online publication and is updated daily on week days.
Initial download of the metrics may take a while.