Fig. 3
Download original image
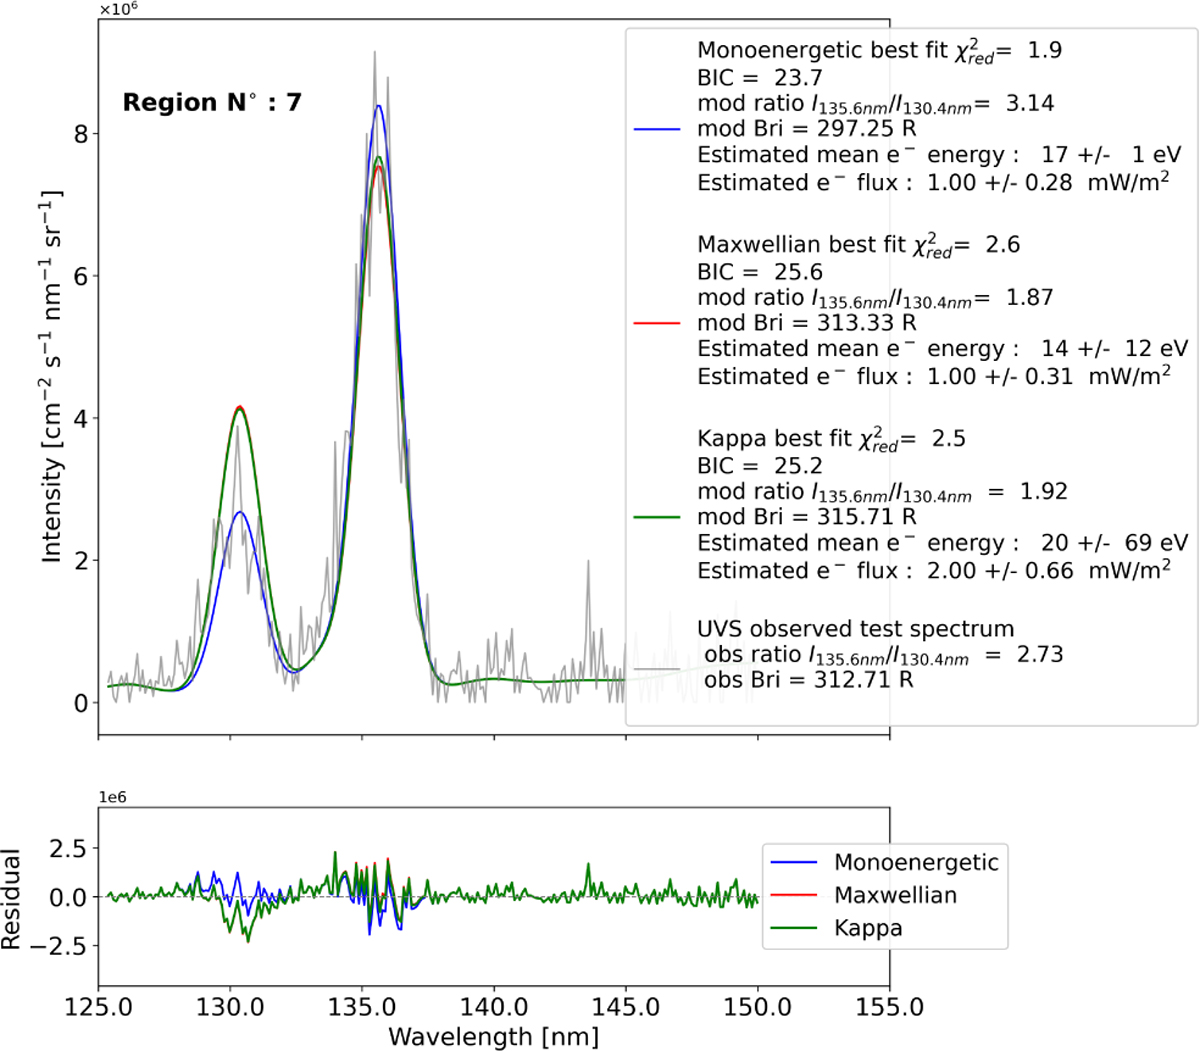
Top: UVS spectrum observed in region 7 (in gray). The blue, red, and green spectra are respectively the best fits obtained by considering a monoenergetic distribution, a Maxwellian distribution, and a kappa distribution. The estimated parameters [〈E〉, ψ] obtained from these fits with our model are shown in the legend. Bottom: residuals of the best fit for each type of electron energy flux distribution. For each distribution type, this residual is calculated by subtracting the best fit from the observed spectrum.
Current usage metrics show cumulative count of Article Views (full-text article views including HTML views, PDF and ePub downloads, according to the available data) and Abstracts Views on Vision4Press platform.
Data correspond to usage on the plateform after 2015. The current usage metrics is available 48-96 hours after online publication and is updated daily on week days.
Initial download of the metrics may take a while.