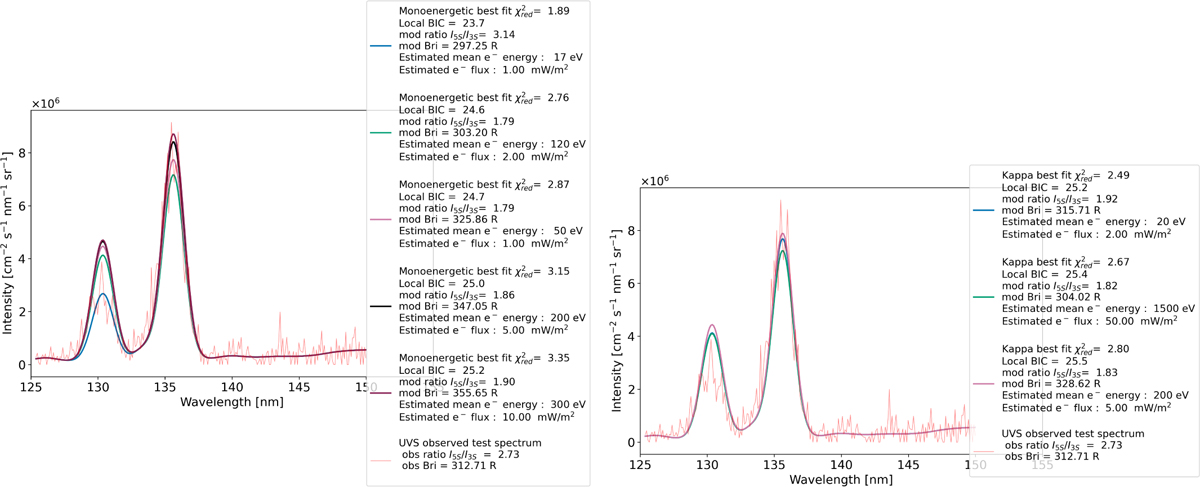
Fig. C.2
Download original image
Fit of the observed spectrum in region 7 using the [〈E〉, ψ] parameters corresponding to the secondary likelihood maxima obtained for both the monoenergetic and kappa distribution cases. In both panels, the observed Juno/UVS spectrum for region 7 is shown in red, and the modeled spectra corresponding to the best-fit parameter pair [〈E〉, ψ] at the global maximum of the likelihood are shown in blue. The left panel corresponds to the monoenergetic distribution, and the right to the kappa distribution. Also shown are the modeled spectra associated with secondary local maxima in the likelihood maps. The local BIC is calculated by considering the local maximum of the likelihood in each case of the electron flux distribution considered in the model.
Current usage metrics show cumulative count of Article Views (full-text article views including HTML views, PDF and ePub downloads, according to the available data) and Abstracts Views on Vision4Press platform.
Data correspond to usage on the plateform after 2015. The current usage metrics is available 48-96 hours after online publication and is updated daily on week days.
Initial download of the metrics may take a while.