| Issue |
A&A
Volume 703, November 2025
|
|
|---|---|---|
| Article Number | L1 | |
| Number of page(s) | 6 | |
| Section | Letters to the Editor | |
| DOI | https://doi.org/10.1051/0004-6361/202557077 | |
| Published online | 30 October 2025 | |
Letter to the Editor
Bar pattern speed modulation across Large Magellanic Cloud stellar populations
1
Instituto de Astrofísica, Departamento de Física y Astronomía, Facultad de Ciencias Exactas, Universidad Andrés Bello, Fernandez Concha 700, Las Condes, Santiago RM, Chile
2
Université de Strasbourg, CNRS, Observatoire Astronomique de Strasbourg, UMR 7550, 67000
Strasbourg, France
3
Lund Observatory, Division of Astrophysics, Lund University, Box 43
221 00
Lund, Sweden
4
Departament de Física Quàntica i Astrofísica (FQA), Universitat de Barcelona (UB), C Martí i Franquès, 1, 08028
Barcelona, Spain
5
Institut de Ciències del Cosmos (ICCUB), Universitat de Barcelona, Martí i Franquès 1, 08028
Barcelona, Spain
6
Institut d’Estudis Espacials de Catalunya (IEEC), C. Esteve Terradas 1, 08860
Castelldefels, (Barcelona), Spain
⋆ Corresponding authors: This email address is being protected from spambots. You need JavaScript enabled to view it.
; This email address is being protected from spambots. You need JavaScript enabled to view it.
Received:
2
September
2025
Accepted:
7
October
2025
Abstract
The bar pattern speed of the Large Magellanic Cloud (LMC) has been measured using Gaia data, suggesting the presence of a slow pattern that is perhaps not rotating at all. Numerical simulations of interacting LMC-SMC systems were able to reproduce a bar stoppage. Here, we report on the first measurement of the bar pattern speed of the LMC as a function of the evolutionary phase of its stellar populations. Astrometric and photometric data of ∼11 million LMC stars from Gaia DR3 were used to build five evolutionary phases, from less to more evolved stars. The Dehnen method, a new procedure to derive bar pattern speeds from kinematics of particles in N-body simulations, was applied to the LMC stellar populations. We observe a modulation of the bar pattern speed with the evolutionary phase, meaning that different LMC stellar populations exhibit different pattern speeds, ranging from −0.9 to 6.6 km s−1 kpc−1. Moreover, less evolved stars have a lower pattern speed, while the bar of more evolved phases tends to rotate faster. The LMC bar is thus extremely slow, ruling out the presence of bar corotation within the disc, in agreement with a previous claim, but this time observed with various stellar populations. It is the first time that a pattern speed is measured separately for different stellar populations in any galaxy. The LMC pattern speed cannot be simply resumed to a singular value, but instead is an overlay of different patterns depending on the evolutionary phase of the stars. Future Gaia releases will be crucial to investigate more deeply the relations of the pattern speed with important astrophysical parameters of stars, such as their age and metallicity, which will be helpful to constrain the chemo-dynamical evolution of the LMC bar.
Key words: astrometry / galaxies: kinematics and dynamics / Local Group / Magellanic Clouds
© The Authors 2025
 Open Access article, published by EDP Sciences, under the terms of the Creative Commons Attribution License (https://creativecommons.org/licenses/by/4.0), which permits unrestricted use, distribution, and reproduction in any medium, provided the original work is properly cited.
This article is published in open access under the Subscribe to Open model. This email address is being protected from spambots. You need JavaScript enabled to view it. to support open access publication.
1. Introduction
Bars in galactic discs are long-lived features that have a crucial role in the secular evolution of the structure and dynamics of stars and gas (Fragkoudi et al. 2025). A fundamental property of a bar is its pattern speed, Ωp, which is a key parameter from which stellar orbits and their relations with the bar-disc resonances can be studied. Only a couple of hundred bar pattern speeds of galaxies have been measured so far (e.g. Cuomo et al. 2020; Williams et al. 2021; Géron et al. 2023), almost exclusively by means of the Tremaine-Weinberg (TW) method (Tremaine & Weinberg 1984) applied to stellar line-of-sight velocity fields. In the TW method, Ωp is deduced from a linear relation between integrals of velocities and positions measured in directions parallel to the line of nodes.
The pioneering work to use both astrometric and spectroscopic data of stars to infer a bar Ωp for a galaxy other than the Milky Way is that of Jiménez-Arranz et al. (2024a, hereafter JA24). These authors measured the Ωp of the stellar bar of the LMC using the third data release of the Gaia mission (Gaia Collaboration 2016, 2021a,b, 2023a). Their analysis is very valuable in many respects. First, since Gaia proper motions allow one to get LMC disc velocity fields in a Cartesian frame with about 11 million stars, it was possible to apply the TW method in its original form, called the ‘in-plane TW method’ (or IPTW, as opposed to the traditional line-of-sight velocity prescription, or LTW). The advantage of applying the TW method in the Cartesian frame is that we can place the x − y plane at any arbitrary position around the z axis perpendicular to the disc before performing the integrals of positions and velocities. Therefore, by rotating the x − y plane around the z axis, there is no limit to the number of values of Ωp that can be measured, making it possible to study its variation as a function of the frame orientation, and likewise, of the bar orientation with respect to the main axes of the disc. JA24 showed that the IPTW method yields a wide range of LMC bar pattern speeds (0 − 60 km s−1 kpc−1), owing to the strong variation of the integrals with the orientation of the frame. Variations occur at any azimuthal angle, not only near the critical minor and major axes of the stellar bar. In addition, they applied the LTW method to ∼30 000 line-of-sight velocities measured by the Gaia Radial Velocity Spectrometer (RVS, Cropper et al. 2018; Katz et al. 2023) and found Ωp ∼ 30 km s−1 kpc−1, which corresponds exactly to the IPTW value when the x axis is aligned with the line of nodes. The agreement between the IPTW and LTW values at this exact orientation is evidence that the LTW value is representative only of a particular orientation of the bar, and not of the real Ωp. In other words, it is highly probable that the LTW method would have yielded any value other than 30 km s−1 kpc−1, within 0 − 60 km s−1 kpc−1, had the LMC bar been oriented differently with respect to the line of nodes. Note that LMC spiral arms could contribute to the issues faced by the TW method as well.
Second, the failure of the TW method to yield a unique pattern speed prompted JA24 to employ other independent methods. One of them searched for the corotation radius, Rc, near the location where the phase angle of the second-order Fourier mode in the tangential velocity field varies by ∼90° (the ‘BV model’). Indeed, inside Rc, the periodic stable orbits are aligned with the bar potential (Contopoulos & Papayannopoulos 1980; Athanassoula et al. 1983; Contopoulos & Grosbol 1989) and the tangential velocity is minimum (maximum, respectively) along the bar major axis (perpendicularly), while beyond Rc it is the opposite; hence, stellar orbits no longer construct an elongated pattern beyond corotation. Note that these theoretical and numerical considerations are additional evidence that Ωp as fast as, for example, 30 km s−1 kpc−1, as measured with the LTW method, must be ruled out because it would correspond to a non-physical ultra-fast bar with a radius 2.3 times larger than the corresponding corotation radius (Rc ∼ 1 kpc, see Fig. 11 of JA24). JA24 thus fitted the BV model to the LMC tangential velocity field at low radii, and found Rc = 4.2 kpc, corresponding to a slow bar with  km s−1 kpc−1. Unlike the TW method, the BV model has no mathematical basis. Also, though seemingly promising with simulations, its application to data remains limited – only galaxies with resolved planar velocities can be studied that way, i.e. only the LMC and the Galaxy (Gaia Collaboration 2023b) – and uncertain because it assumes that the variation in the kinematic bisymmetry by ∼90° is due only to the bar dynamics. However, the LMC exhibits a spiral structure that develops along the leading sides of the bar so that it is possible that Rc = 4.2 kpc is a lower limit value of the bar corotation, and Ωp = 18.5 km s−1 kpc−1 an upper limit, as spiral arms could begin to affect the searched variation in the phase angle at too small a radius.
Third, and even more compellingly, JA24 applied the new mathematical model by Dehnen et al. (2023, the “Dehnen method”), which was developed to infer bar pattern speeds from single snapshots of numerical simulations. Given that the method utilizes the density and planar kinematics of stellar-like particles, it should be well suited for studying the properties of the bars of the Milky Way (Zhang et al. 2024) and the LMC using Gaia astrometry of stars. JA24 evidenced an almost non-rotating LMC bar, perhaps with a slight hint of counter-rotation (Ωp = −1.0 ± 0.5 km s−1 kpc−1). This surprising result suggests the important role of the interaction with the Small Magellanic Cloud (SMC) on the dynamics of the LMC, even in the inner disc region. To assess this possibility, Jiménez-Arranz & Roca-Fàbrega (2025) then searched for non-rotating bars in KRATOS, a suite of numerical simulations of tidal LMC-SMC-like interacting systems (Jiménez-Arranz et al. 2024b), and found that bars can slow down until stopping their rotation. This process occurs rapidly after the second passage of the SMC-like companion at pericentre, followed by a temporary (∼100 Myr) stage of extremely low rotation until the Ωp rises again.
This stunning outcome in JA24 marks the first discovery of an almost stationary bar, and further analysis will undoubtedly be necessary to fully understand its implications for the evolution and dynamics of bars, as well as the recent evolution of the LMC. Within this framework, we propose to extend the analysis of JA24 to investigate for the first time the properties of the bar pattern speed as a function of the evolutionary phase of stellar populations in the LMC. To explore questions such as how the Ωp of less evolved stars in the bar compares with that of evolved stars, and whether there is a singular pattern speed for the LMC bar, we leverage the selection of various stellar evolutionary phases in a colour-magnitude diagram (CMD) of LMC stars from Gaia Collaboration (2021c, hereafter GCL21), using the refined samples provided by Jiménez-Arranz et al. (2023, hereafter JA23) to measure their bar pattern speed by means of the Dehnen method.
2. Methodology and observational data
We used the program patternSpeed.py (v0.2) of Dehnen et al. (2023) to infer Ωp and the phase angle ϕb of the bar. They were measured from the density and kinematics once the bar region, defined by its boundaries [R0, R1], had been identified from a Fourier analysis of the stellar density. The bar angle is the phase angle of the second-order Fourier coefficient of the density, and Ωp is its time derivative, dϕb/dt. More details are summarized in Appendix A. The Dehnen method performs extremely well with single snapshots of numerical simulations of isolated or interacting barred spirals when compared to the direct measurement of the pattern speeds from differentials of ϕb along consecutive time snapshots (Dehnen et al. 2023; Jiménez-Arranz et al. 2024a,b; Semczuk et al. 2024; Zhang et al. 2024; Jiménez-Arranz & Roca-Fàbrega 2025). It remains stable and robust, regardless of the dynamical equilibrium of the outer disc. Comparisons with the TW method applied to mock data of discs simulated in a cosmological context for the case in which the bar phase makes an angle of 45° with respect to the disc major axis were also performed in Roshan et al. (2025). With the LMC data, the equivalents of particles are the stars.
The data used in this study are from the Gaia mission (Gaia Collaboration 2016), provided by the third version of its catalogue (Gaia Collaboration 2021a,b, 2023a). Our samples of stars at various evolutionary stages were constructed from the sample of LMC stars defined in JA23, to which we applied the evolutionary phases described by GCL21. JA23 applied neural network (NN) classifications that provided different samples depending on the desired level of completeness and purity. They defined a sample that prioritizes completeness (hereafter the NN Complete sample) made of 12 116 762 LMC stars, and that was our starting point. We built stellar sub-samples from it by applying the polygonial areas designed by GCL21 from a CMD of LMC stars (see their Fig. 2), delineating eight evolutionary phases. Main-sequence (MS) stars in GCL21 were split into three sub-samples spread over stars as young as a few tens of millions of years and as old as ∼2 Gyr. They were referred to as ‘young’ stellar populations, being less evolved and/or younger than red clump (RC), red giant branch (RGB), asymptotic giant branch (AGB) and RR Lyrae (RRL) stars. The RR Lyrae phase represents the oldest stars in their sample (≳10 Gyr). GCL21 also identified the blue loop (BL) sub-sample as stars from the CMD mostly located closer to the evolved RGB, RC, and AGB phases, and as the feature connecting to the young phase of the MS. The BL sub-sample is thus made of stars of various ages that depend on their initial masses. Only a few percent of them are classical Cepheids (Ripepi et al. 2022), and thus as young as 50 − 350 Myr (GCL21) and as the younger stars of the MS, though they are not at the same stage of evolution, while other BL stars can be as old as a few gigayears (the least massive ones). For simplicity, we did not make any difference between the three evolutionary phases along the MS, and merged them into a single phase representing a sub-sample of 4 500 453 stars referred to as the ‘Young’ sub-sample, by analogy to GCL21. Moreover, we merged the most evolved AGB and RRL stages of GCL21 into an ‘AGB+RRL’ sub-sample with 278 629 stars as they were individually sub-samples with smaller numbers of stars. Our RC, RGB, and BL sub-samples are made of 3 737 496, 2 765 725, and 252 958 stars, respectively. In total, our final sample is thus made of 11 535 261 stars spread over five evolutionary phases (Table A.1). The difference of 581 501 stars with the NN Complete sample of JA23 and JA24 is due to stars located in a few areas of the CMD that could not be assigned to any particular phase (see more details in GCL21). We assume hereafter the same LMC parameters as in GCL21 and JA24 (and reference therein): a distance of 49.59 kpc (Pietrzyński et al. 2019), equatorial coordinates of the kinematic centre at (81.28° , − 69.78° ), the disc inclination (34°), and the position angle of the major axis (310°). These values were derived by fitting an infinitely thin plane of constant inclination and position angle, assuming axisymmetric rotational motions (GCL21). We thus implicitly assume that all stars lie in the plane of the LMC. It is nonetheless worth noting that the inner and outer parts of the LMC disc may not be fully coplanar owing to an asymmetric disc warping (Jiménez-Arranz et al. 2025). Additionally, given that distances to some LMC stars can be constrained with methods such as the tip of the RGB, RC stars (Saroon & Subramanian 2022), or variable stars such as Cepheids (Ripepi et al. 2022), a small sub-sample of pure bar and disc stars could in principle be defined. All of these considerations would make it possible to study the effect of the contamination of LMC halo stars, as well as the potential impact of the warp, on the inner disc kinematics and Ωp. However, these studies are beyond the scope of this Letter. The formalism to get the Cartesian positions and velocities of stars in the LMC reference plane from astrometric data can be found in van der Marel & Cioni (2001), van der Marel et al. (2002), and JA23.
3. Results
The program patternSpeed.py was run with the five sub-samples of evolutionary stages: Young, RC, RGB, BL, and AGB+RRL (data shown in Appendix A). It was also run using the entire sample of 11 535 261 stars combining the five phases (‘Total’ sample hereafter). We allowed the program to find the bar properties without constraints on the bar region [R0, R1]. Additionally, we measured the bar properties by fixing the bar region to the range R0 ∼ 0.8 kpc, R1 ∼ 2.3 kpc found by JA24 with their NN Complete sample, enabling easier comparisons between both studies. The inferred pattern speeds are shown in Fig. 1 and results are listed in Table A.1. The phase angle of the LMC bar is well constrained and quite uniform throughout the stellar populations (dashed line in each map of Fig. B.1). It is ∼19° on average (∼20° for the fixed bar region), with a standard deviation of 3°. The maximum difference of ∼9° occurs between the RC and Young sub-samples. The mean inner bound of the bar region is R0 ∼ 0.7 kpc, but with a total variation of 800 pc. This is caused by the outlier value for the BL sub-sample. On the contrary, the mean bar radius is R1 ∼ 2.3 kpc, with very little scatter (100 pc).
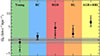 |
Fig. 1. Modulation of Ωp with the evolutionary phase. Filled symbols (open, respectively) are results obtained with a free (fixed) bar region. The dashed line, Ωp = 0.1 ± 0.7 km s−1 kpc−1, is for the Total sample. The dotted line, Ωp = −1.0 ± 0.5 km s−1 kpc−1, is for the NN Complete sample of JA24. |
As for Ωp, a first finding is that values are very low. The average pattern speed is 2.2 km s−1 kpc−1 (standard deviation of 3.6 km s−1 kpc−1), and the mean and standard deviation weighted by the number of stars are −0.2 and 2.8 km s−1 kpc−1, as measured within the fixed range [R0, R1]=[0.8, 2.3] kpc for easier comparisons (right column of Table A.1). The quoted uncertainties are low as well, 1.4 km s−1 kpc−1 on average, and should be regarded as a lower limit. This corresponds to an uncertainty of more than 60%, relative to the mean pattern speed of 2.2 km s−1 kpc−1, however. Systematic uncertainties should dominate the error budget, probably at the level of a few km s−1 kpc−1. Among various sources of systematics, there are kinematical disturbances from spiral arms or the warp (GCL21, Jiménez-Arranz et al. 2025), selection effects due to sample contamination by Milky Way halo stars, and observational effects such as the Gaia scanning law (e.g. the sawtooth pattern seen in the velocity fields, GCL21 and Appendix B). We think the latter systematics is likely to have the most significant effect on the astrometry.
With such small angular frequencies, the LMC hosts an extremely slow bar, and this applies to each of the evolutionary phases. This is much slower than the indirect measurement of Ωp ∼ 18.5 km s−1 kpc−1 by JA24 with the BV model via a corotation radius at Rc = 4.2 kpc, but more consistent with the amplitude these authors found with the Dehnen method. JA24 suggest that this has important implications because no corotation with disc stars exists in this case. Indeed it is impossible to join Ωp with the angular frequency of stars, Ω = vϕ/R, given the known rotation curve(s) of the LMC. A possibility to keep corotation in the disc would be to have the circular velocity not well traced by the tangential velocity. For instance, assuming the maximum value of ∼7 km s−1 kpc−1 (for the most evolved stars) and a corotation radius in the middle of the disc (Rc ∼ 4 kpc), consistent with the BV model of JA24, it would require a circular velocity significantly smaller than the rotation velocity at this radius – that is, vcirc = ΩpRc ∼ 30 km s−1 – whereas vϕ ∼ 80 km s−1 (Fig. 11 of JA24). Corotation radii closer to the bar radius (R ∼ 2.3 kpc) would also imply a large difference with vϕ (vcirc ∼ 18 km s−1, vϕ ∼ 60 km s−1). However, this does not seem realistic because the opposite trend, vϕ < vc, is supposed to occur owing to the asymmetric drift exerted on stellar populations, principally on the more evolved ones. Another possibility is that the stellar rotation curve is incorrect. This assertion would be supported by the fact that stellar rotation curves are always measured assuming an idealized flat disc and axisymmetric motions, but the reality is quite different. Therefore, inference of a vϕ(R) profile within the framework of a warped LMC disc similar to the one proposed in Jiménez-Arranz et al. (2025) would certainly help in assessing this statement. An alternative option, perhaps more realistic, is that the lack of corotation is a transient phenomenon, as observing Ωp ∼ 0 does not last long in the numerical modelling of Jiménez-Arranz & Roca-Fàbrega (2025).
Even more interesting is the observation of a modulation of Ωp with the evolutionary phase. The RC, RGB, and BL phases are within ∼1.4 − 4.6 km s−1 kpc−1, the most evolved AGB+RRL phase has Ωp = 6.6 ± 1.6 km s−1 kpc−1, and the Young phase has Ωp = −0.9 ± 1.2 km s−1 kpc−1. This latter thus differs by more than 110% from, for example, those of the RGB or the AGB+RRL phases. To our knowledge, it is the first time a modulation with the stellar phase is evidenced in a bar. The different kinematics observed in the bar region through the stellar populations is likely responsible for the different bar pattern speeds: rotation is faster and radial motions larger for the least evolved populations (Fig. B.1), whereas random motions are stronger and velocities more anisotropic for more evolved stars (see e.g. Sect. 5.2.1 and Fig. 13 in GCL21). We also see that leaving the bar region free or fixed does not affect results (Fig. 1). The phase angles and pattern speeds are barely modified, slightly increasing the difference between the least and most evolved populations. This is because it is R1 that has the most significant role in Ωp, and this radius is uniform among the stellar phases. Also notable is that Ωp and the evolution stage seem correlated, with more evolved stars rotating faster than the bar of less evolved stars. Further analysis will be necessary to study this trend, however.
Then, we observe a good agreement between the result of JA24 and Ωp = −1.3 ± 0.6 km s−1 kpc−1 for the Total sample (fixed radial range case, right column of Table A.1). This is not surprising, since both samples were built on JA23. The new finding here is that Ωp = −1.3 km s−1 kpc−1 is an equilibrium value between the phases with the largest number of stars (−3.6 km s−1 kpc−1 for Young, 0.9 km s−1 kpc−1 for RC stars). This suggests significant selection effects in pattern speed derivation. The larger the size of a given sub-sample, the higher its contribution to the pattern speed measured for the Total sample. The values obtained for our Total sample or the JA24’s Complete NN sample are therefore not necessarily representative of a ‘global’ LMC bar pattern speed. It is even unclear whether one should exist owing to the modulation.
Finally, there is no reason to think that the dynamics of the LMC bar is an exception. Instead, the LMC bar kinematics behaves as expected from the viewpoint of numerical simulations, and it is very similar to that of the Milky Way bar. We thus suggest that bar pattern speed measurements, and in particular those made by means of integral field spectroscopy, should systematically include a reference stellar population, given that such modulation with the evolution phase is likely present in many galactic bars, if not all, and that pattern speed inference is prone to selection effects. A challenge for current integral field stellar spectroscopy of galaxies, however, is its coarse spectral resolution, making the differentiation of evolutionary populations extremely difficult, if not impossible.
4. Concluding remarks
This study has measured the pattern speed of the LMC bar by means of the new Dehnen method applied to astrometric data from the Gaia mission for a sample of ∼11 million sources spanning various evolutionary phases. We find strongly different pattern speeds, and that Ωp for the bar of less evolved stars, those along the MS, corresponds to a feature with almost no rotation, whereas those of more evolved stars are faster, though still rotating at an extremely low pace. These results are the first insight of the modulation in Ωp of a stellar bar with the evolutionary phase of stars. There is no singular pattern speed for the LMC bar but there are as many pattern speeds as there are stellar populations. This raises the question of whether it is relevant to reduce the bar Ωp to a single value as stars that build it are not on the same kinematic track, and may have even experienced different evolutionary scenarios. Such low values mean that the LMC is hosting the slowest bar ever observed in a galaxy, which confirms previous claims. No corotation radius could be found inside the disc given the LMC tangential velocity. A stationary bar, and conversely the absence of corotation, is probably a transient feature provoked by the tidal interaction with the SMC, according to recent N-body simulations.
This work is the first step towards a more comprehensive analysis of the pattern speed(s) of the LMC bar as a function of the properties of its stellar populations. The fourth release of the Gaia catalogue expected by the end of 2026 will provide proper motions that are at least two times more accurate than the current version. The selection of LMC disc stars will thus be improved, and the systematic effects on Ωp measurement significantly reduced, particularly those coming from the contamination by Milky Way halo stars and the Gaia scanning law. Furthermore, the Gaia Data Processing and Analysis Consortium will provide results from a detailed modelling of the spectroscopic and/or photometric data for up to a few million sources from our sub-samples. This will allow us to investigate the modulation of the bar dynamical parameters in unprecedented detail. How smooth it will be as a function of stellar metallicity and age, how it relates to the star formation history or the recent evolution of the LMC-SMC interaction, whether the seemingly counter-rotating bar of the less evolved stellar phase is a real feature, and whether Ωp modulation is present within the Milky Way bar as well are all questions that the Gaia community will unavoidably address in the near future.
Acknowledgments
This work has made use of data from the European Space Agency (ESA) mission Gaia (https://www.cosmos.esa.int/gaia), processed by the Gaia Data Processing and Analysis Consortium (DPAC, https://www.cosmos.esa.int/web/gaia/dpac/consortium). Funding for the DPAC has been provided by national institutions, in particular the institutions participating in the Gaia Multilateral Agreement. We thank Florent Renaud for insightful discussions. LC acknowledges financial support from the French Agence Nationale de la Recherche and the Chilean Agencia Nacional de Investigación y Desarrollo through the Fondo Nacional de Desarrollo Científico y Tecnológico Regular Project 1210992. OJA acknowledges funding from “Swedish National Space Agency 2023-00154 David Hobbs The GaiaNIR Mission” and “Swedish National Space Agency 2023-00137 David Hobbs The Extended Gaia Mission”.
References
- Athanassoula, E., Bienayme, O., Martinet, L., & Pfenniger, D. 1983, A&A, 127, 349 [NASA ADS] [Google Scholar]
- Contopoulos, G., & Grosbol, P. 1989, A&ARv, 1, 261 [Google Scholar]
- Contopoulos, G., & Papayannopoulos, T. 1980, A&A, 92, 33 [NASA ADS] [Google Scholar]
- Cropper, M., Katz, D., Sartoretti, P., et al. 2018, A&A, 616, A5 [NASA ADS] [CrossRef] [EDP Sciences] [Google Scholar]
- Cuomo, V., Aguerri, J. A. L., Corsini, E. M., & Debattista, V. P. 2020, A&A, 641, A111 [EDP Sciences] [Google Scholar]
- Dehnen, W., Semczuk, M., & Schönrich, R. 2023, MNRAS, 518, 2712 [Google Scholar]
- Fragkoudi, F., Grand, R. J. J., Pakmor, R., et al. 2025, MNRAS, 538, 1587 [Google Scholar]
- Gaia Collaboration (Prusti, T., et al.) 2016, A&A, 595, A1 [NASA ADS] [CrossRef] [EDP Sciences] [Google Scholar]
- Gaia Collaboration (Brown, A. G. A., et al.) 2021a, A&A, 649, A1 [NASA ADS] [CrossRef] [EDP Sciences] [Google Scholar]
- Gaia Collaboration (Brown, A. G. A., et al.) 2021b, A&A, 650, C3 [EDP Sciences] [Google Scholar]
- Gaia Collaboration (Luri, X., et al.) 2021c, A&A, 649, A7 [EDP Sciences] [Google Scholar]
- Gaia Collaboration (Vallenari, A., et al.) 2023a, A&A, 674, A1 [NASA ADS] [CrossRef] [EDP Sciences] [Google Scholar]
- Gaia Collaboration (Drimmel, R., et al.) 2023b, A&A, 674, A37 [CrossRef] [EDP Sciences] [Google Scholar]
- Géron, T., Smethurst, R. J., Lintott, C., et al. 2023, MNRAS, 521, 1775 [CrossRef] [Google Scholar]
- Jiménez-Arranz, Ó., & Roca-Fàbrega, S. 2025, A&A, 698, L7 [NASA ADS] [CrossRef] [EDP Sciences] [Google Scholar]
- Jiménez-Arranz, Ó., Romero-Gómez, M., Luri, X., et al. 2023, A&A, 669, A91 [NASA ADS] [CrossRef] [EDP Sciences] [Google Scholar]
- Jiménez-Arranz, Ó., Chemin, L., Romero-Gómez, M., et al. 2024a, A&A, 683, A102 [NASA ADS] [CrossRef] [EDP Sciences] [Google Scholar]
- Jiménez-Arranz, Ó., Roca-Fàbrega, S., Romero-Gómez, M., et al. 2024b, A&A, 688, A51 [NASA ADS] [CrossRef] [EDP Sciences] [Google Scholar]
- Jiménez-Arranz, Ó., Horta, D., van der Marel, R. P., et al. 2025, A&A, 698, A88 [NASA ADS] [CrossRef] [EDP Sciences] [Google Scholar]
- Katz, D., Sartoretti, P., Guerrier, A., et al. 2023, A&A, 674, A5 [NASA ADS] [CrossRef] [EDP Sciences] [Google Scholar]
- Pietrzyński, G., Graczyk, D., Gallenne, A., et al. 2019, Nature, 567, 200 [Google Scholar]
- Ripepi, V., Chemin, L., Molinaro, R., et al. 2022, MNRAS, 512, 563 [NASA ADS] [CrossRef] [Google Scholar]
- Roshan, M., Habibi, A., Aguerri, J. A. L., et al. 2025, A&A, 701, A160 [NASA ADS] [CrossRef] [EDP Sciences] [Google Scholar]
- Saroon, S., & Subramanian, S. 2022, A&A, 666, A103 [NASA ADS] [CrossRef] [EDP Sciences] [Google Scholar]
- Schölch, M., Jiménez-Arranz, Ó., Romero-Gómez, M., et al. 2025, A&A, 701, A227 [NASA ADS] [CrossRef] [EDP Sciences] [Google Scholar]
- Semczuk, M., Dehnen, W., Schönrich, R., & Athanassoula, E. 2024, A&A, 692, A159 [NASA ADS] [CrossRef] [EDP Sciences] [Google Scholar]
- Tremaine, S., & Weinberg, M. D. 1984, ApJ, 282, L5 [Google Scholar]
- van der Marel, R. P., & Cioni, M.-R. L. 2001, AJ, 122, 1807 [Google Scholar]
- van der Marel, R. P., Alves, D. R., Hardy, E., & Suntzeff, N. B. 2002, AJ, 124, 2639 [NASA ADS] [CrossRef] [Google Scholar]
- Williams, T. G., Schinnerer, E., Emsellem, E., et al. 2021, AJ, 161, 185 [Google Scholar]
- Zhang, H., Belokurov, V., Evans, N. W., Kane, S. G., & Sanders, J. L. 2024, MNRAS, 533, 3395 [CrossRef] [Google Scholar]
Appendix A: Measured bar pattern speeds
In the Dehnen method, the pattern speed of the bisymmetric perturbation is given by  , where C2 = ∑iμiW(Ri)cos2ϕi and S2 = ∑iμiW(Ri)sin2ϕi, ϕ is the azimuthal angle in the disc and μ the individual particle mass (see Appendix A of Dehnen et al. 2023, for more details). W(R) is a weight window function which allows processing the radial membership of particles to the bar. This is a major difference with the TW method whose integrals are derived along the largest radial extent possible, thus including spiral and/or outer disc regions that do not trace at all the bar kinematics. A simple function delineating the bar region could thus be a top-hat filter, but Dehnen et al. (2023) showed it produces a systematic overestimate of up to 25% of the ground-truth Ωp. Dehnen et al. (2023) thus introduced a smoother transition between the bar extremity for stars beyond R1 (their Eq. 25), and we used their smoothed window function as weights in our analysis. Table A.1 gives the results obtained with the different stellar populations.
Results of the Dehnen method applied to the LMC stellar evolutionary phases.
Appendix B: Density and velocity maps of stellar evolutionary phases
Figure B.1 shows the density and velocity maps for the evolutionary phases. The radial and tangential velocities are given relatively to their respective median value  , measured within annular rings. The density is higher in the inner region, where the LMC bar can be clearly identified. The Young phase shows more prominent dust lanes along the bar edges and the spiral arms than more evolved phases. All velocity maps exhibit the kinematic imprints of the stellar bar. These include sign changes of vR along directions near the major and minor axes of the bar, and lower and larger values of vϕ roughly observed inside R1 along the bar major and minor axes respectively. Extrema of vR are seen near directions of ∼45° w.r.t. the bar major axis. They are stronger for the less evolved than the more evolved phases. The quadrupoles in the radial and tangential velocities also show some degree of asymmetry proably caused by the tidal interaction with the LMC (see more details in Schölch et al. 2025). Similar features have been showed in GCL21, JA23 or JA24. Also, note the stronger imprint of the sawtooth pattern caused by the Gaia scanning law (GCL21) in the bar region of the vR map for the RGB or RC phases, at, for example, (x, y)∼(−1, −1) kpc.
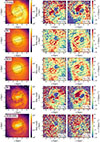 |
Fig. B.1. Maps of LMC star count (left), radial ( |


All Tables
All Figures
|
Fig. 1. Modulation of Ωp with the evolutionary phase. Filled symbols (open, respectively) are results obtained with a free (fixed) bar region. The dashed line, Ωp = 0.1 ± 0.7 km s−1 kpc−1, is for the Total sample. The dotted line, Ωp = −1.0 ± 0.5 km s−1 kpc−1, is for the NN Complete sample of JA24. |
| In the text | |
|
Fig. B.1. Maps of LMC star count (left), radial ( |
| In the text | |
Current usage metrics show cumulative count of Article Views (full-text article views including HTML views, PDF and ePub downloads, according to the available data) and Abstracts Views on Vision4Press platform.
Data correspond to usage on the plateform after 2015. The current usage metrics is available 48-96 hours after online publication and is updated daily on week days.
Initial download of the metrics may take a while.