Fig. 4.
Download original image
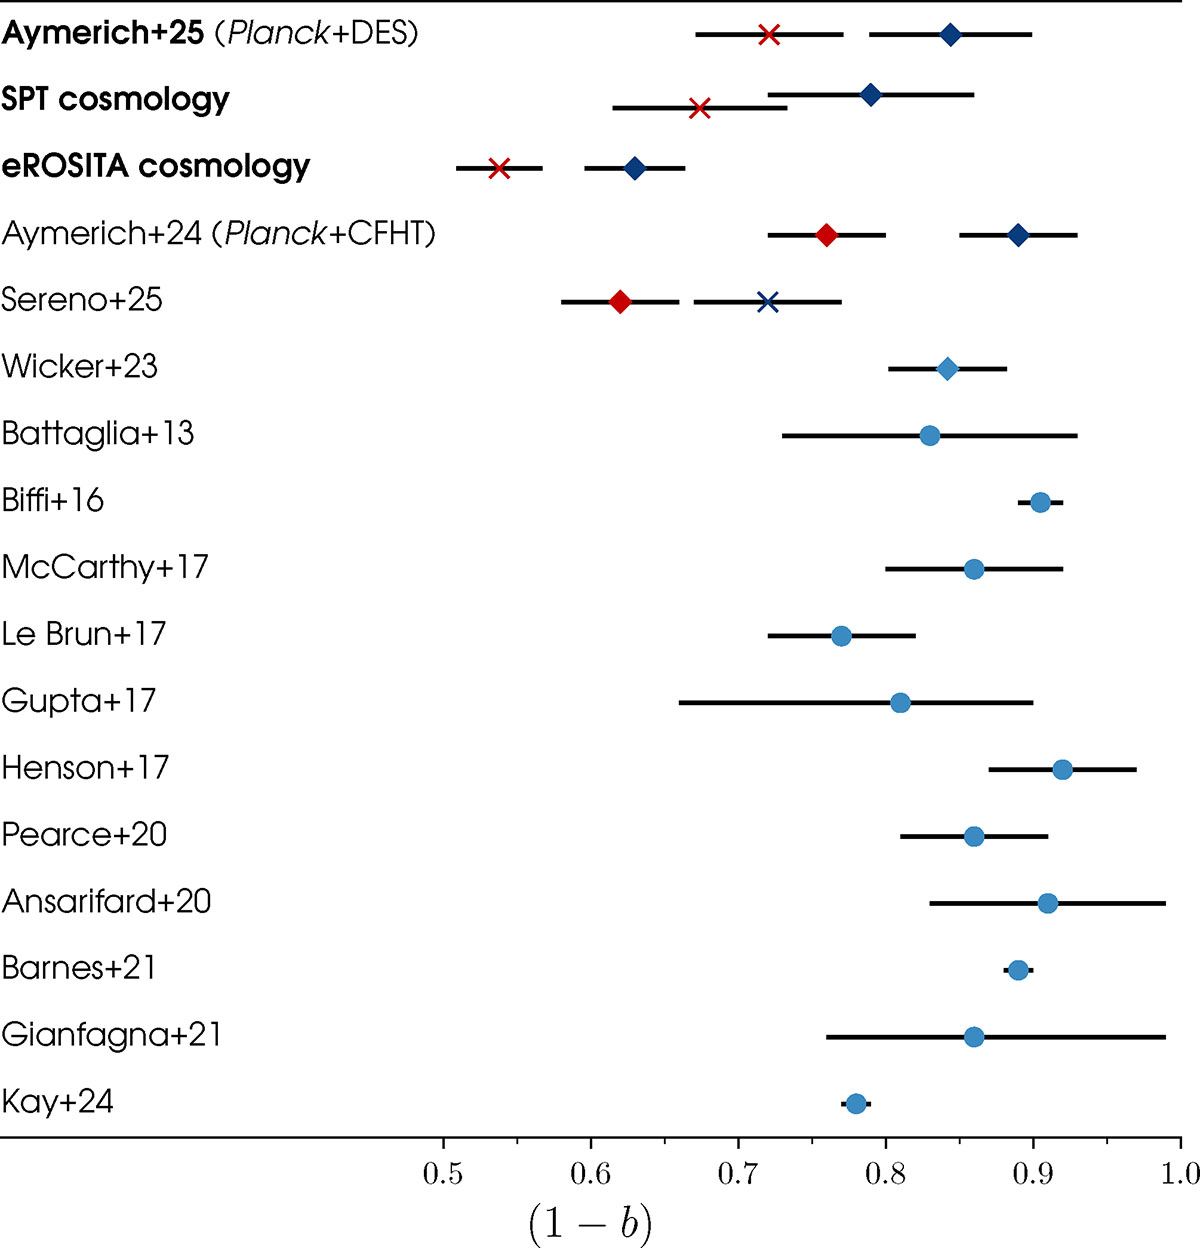
Comparison of the biases obtained in Sect. 2.2 with values from the literature. Two values for a single study indicate that it is subject to the X-ray temperature calibration differences. A dark blue diamond corresponds to a Chandra bias and a red diamond to an XMM-Newton bias. The crosses indicate Chandra-like or XMM-like biases, i.e. biases rescaled to the expected value with data from the other instrument. The light blue points correspond to analyses insensitive to the X-ray temperature calibration problem, with a diamond indicating an observational value and a dot indicating a value derived from simulations.
Current usage metrics show cumulative count of Article Views (full-text article views including HTML views, PDF and ePub downloads, according to the available data) and Abstracts Views on Vision4Press platform.
Data correspond to usage on the plateform after 2015. The current usage metrics is available 48-96 hours after online publication and is updated daily on week days.
Initial download of the metrics may take a while.