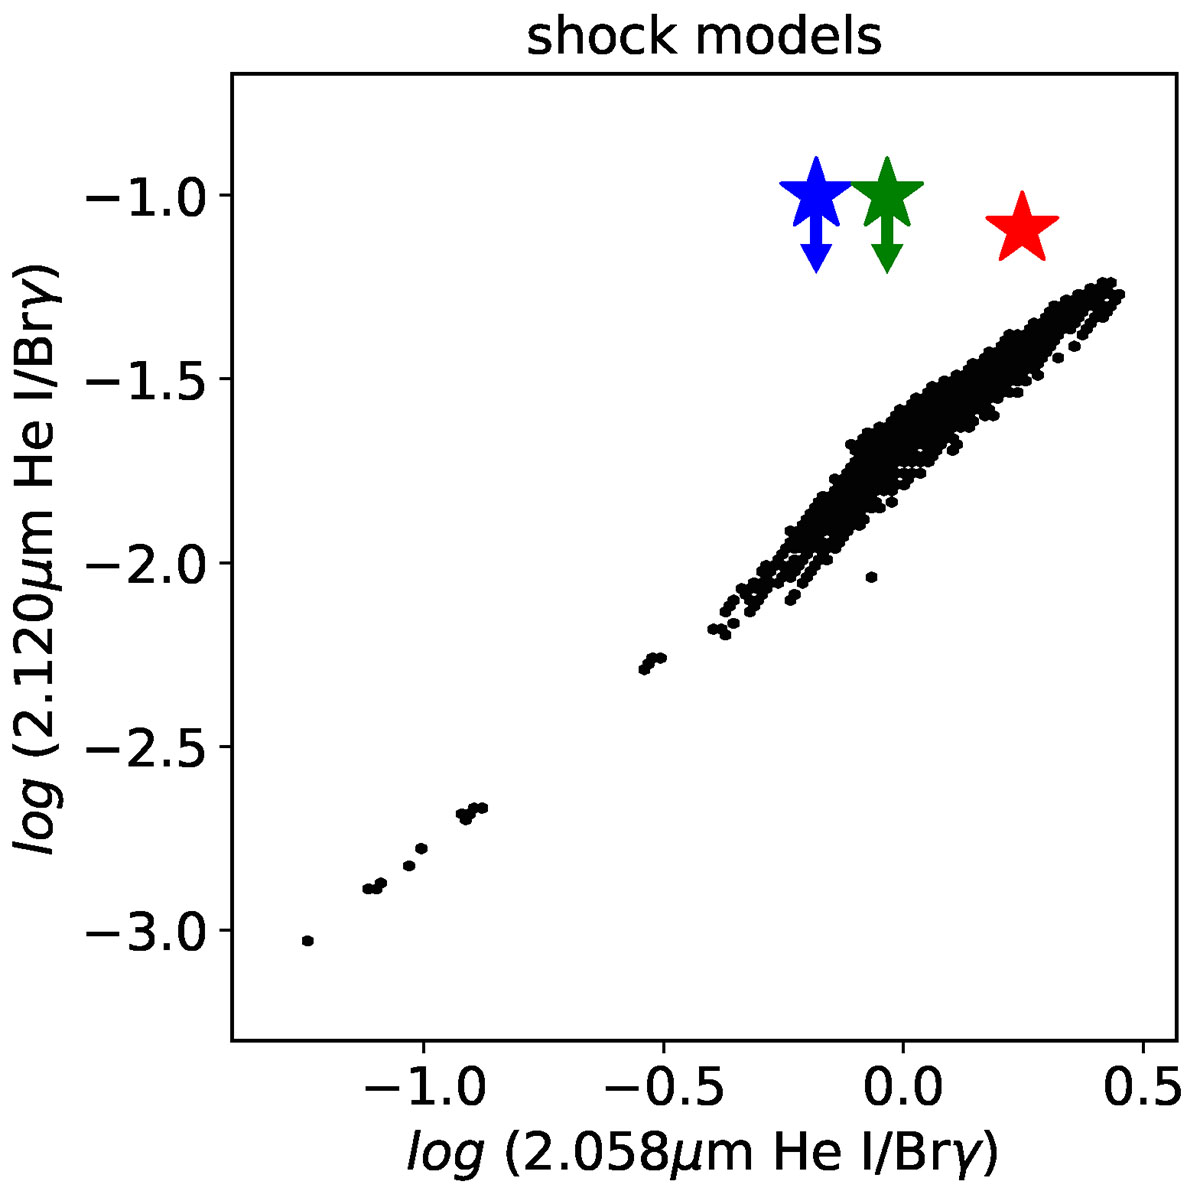
Fig. 2.
Download original image
Emission-line ratio diagnostic diagram for recombination lines of Brγ at 2.166 μm and He I lines at 2.058 and 2.120 μm. The region occupied by the black points corresponds to the values expected from the shock models of Sutherland & Dopita (2017). The filled stars are IRAS 15103−5754 (blue), IRAS 15445−5449 (green), and IRAS 18443−0231 (red). The sizes of the symbols are larger than their errors. The arrows indicate upper limits for the flux of the He I 2.120 μm emission line (see Fig. 1 and Table B.1).
Current usage metrics show cumulative count of Article Views (full-text article views including HTML views, PDF and ePub downloads, according to the available data) and Abstracts Views on Vision4Press platform.
Data correspond to usage on the plateform after 2015. The current usage metrics is available 48-96 hours after online publication and is updated daily on week days.
Initial download of the metrics may take a while.