| Issue |
A&A
Volume 703, November 2025
|
|
|---|---|---|
| Article Number | L7 | |
| Number of page(s) | 5 | |
| Section | Letters to the Editor | |
| DOI | https://doi.org/10.1051/0004-6361/202557103 | |
| Published online | 04 November 2025 | |
Letter to the Editor
Low- and high-velocity “water fountains”: Different evolutionary stages
1
Instituto de Astrofísica de Andalucía, CSIC, Glorieta de la Astronomía s/n, E-18008 Granada, Spain
2
Instituto de Astrofísica, Departamento de Física y Astronomía, Facultad de Ciencias Exactas, Universidad Andrés Bello, Fernández Concha 700, Las Condes, Santiago, Chile
⋆ Corresponding author: This email address is being protected from spambots. You need JavaScript enabled to view it.
Received:
4
September
2025
Accepted:
2
October
2025
Abstract
“Water fountains” (WFs) are optically obscured evolved stars. Most of them are thought to be in the post-asymptotic giant branch (post-AGB) phase, and they are characterized by H2O maser emission tracing molecular jets. Interestingly, four WFs (IRAS 15445−5449, IRAS 18019−2216, IRAS 18443−0231, and IRAS 18464−0140) and one WF candidate (IRAS 18480+0008) are potentially planetary nebulae (PNe) because they exhibit radio continuum emission, suggesting the presence of a photoionized region characteristic of PNe. To classify these objects, we obtained K-band (2.0–2.3 μm) spectra of these WFs, including the only WF PN known (IRAS 15103−5754) for comparison. Our spectra reveal two groups of sources: (i) “low-velocity” WFs with an H2O maser velocity spread of ≲50 km s−1 (IRAS 18019−2216, IRAS 18464−0140, and IRAS 18480+0008) showing the CO band at 2.29 μm in absorption, typical of cool giant stars, and no emission lines, and (ii) “high-velocity” WFs, velocity spread of ≳50 km s−1 (IRAS 15103−5754, IRAS 15445−5449, and IRAS 18443−0231), exhibiting emission lines of Brγ, He I, and H2, consistent with hotter central stars and/or shock-excited emission. The emission line ratios of these lines in IRAS 18443−0231 indicate that it may be a nascent PN. The spectrum of IRAS 15445−5449 also shows a CO band and Na I doublet in emission, suggesting the presence of a compact circumstellar disk and/or active mass loss. These results favor the previously suggested notion that the difference between low- and high-velocity WFs is not simply a projection effect but a reflection of intrinsically different evolutionary stages. Moreover, the results are also consistent with the idea of an increase in the jet ejection velocity as the post-AGB evolution proceeds.
Key words: masers / techniques: spectroscopic / astronomical databases: miscellaneous / stars: AGB and post-AGB / stars: jets
© The Authors 2025
 Open Access article, published by EDP Sciences, under the terms of the Creative Commons Attribution License (https://creativecommons.org/licenses/by/4.0), which permits unrestricted use, distribution, and reproduction in any medium, provided the original work is properly cited.
This article is published in open access under the Subscribe to Open model. This email address is being protected from spambots. You need JavaScript enabled to view it. to support open access publication.
1. Introduction
“Water fountains” (WFs) are evolved stars with H2O maser emission tracing collimated mass loss. Most WFs are believed to be in the post-asymptotic giant branch (post-AGB) phase. High-resolution observations of the H2O masers have shown incipient small-scale (∼102–103 au) bipolar jets that can reach velocities of hundreds of kilometers per second (e.g., Imai et al. 2002; Boboltz & Marvel 2005; Gómez et al. 2011; Uscanga et al. 2023). The short kinematical ages estimated for WF jets (≲100 yr; e.g., Day et al. 2010; Yung et al. 2011; Orosz et al. 2019; Tafoya et al. 2020) suggest that these small-scale jets could be one of the initial manifestations of non-spherical mass loss that occur in evolved low- and intermediate-mass stars (e.g., Imai et al. 2002). So far, 18 objects have been confirmed as WFs (Gómez et al. 2017; Cala et al. 2025). Among these, only one (W43A) has been classified as an AGB star (Imai et al. 2002, 2005), while another (IRAS 15103−5754) has been classified as a planetary nebula (PN), and it could be one of the youngest PNe known (Gómez et al. 2015).
Recently, four additional interesting objects were identified: three new confirmed WFs (IRAS 18019−2216, IRAS 18443−0231, and IRAS 18464−0140) and a new WF candidate, IRAS 18480+0008 (Cala et al. 2025). Remarkably, these four objects present radio continuum emission indicating the presence of an ionized region that characterizes PNe. Thus, they could be new WF PNe. However, definitive classification as PNe requires further spectroscopic confirmation since shock-ionized gas around post-AGB stars can also produce radio continuum emission (e.g., Cerrigone et al. 2017; Pérez-Sánchez et al. 2017). We note that, in addition to these four objects and the WF PN IRAS 15103−5754, only one additional object, WF IRAS 15445−5449, presents radio continuum emission, and its evolutionary stage is unknown (Pérez-Sánchez et al. 2013). Interestingly, the radio continuum emission in IRAS 15445−5449, IRAS 15103−5754, and IRAS 18443−0231 is not mainly due to free-free processes. Instead, it is mostly due to a non-thermal nature (Pérez-Sánchez et al. 2013; Suárez et al. 2015; Cala et al. 2025).
Most WFs are optically obscured (e.g., Suárez et al. 2008; Gómez et al. 2017; Pérez-Sánchez et al. 2017) because they are surrounded by thick circumstellar envelopes, probably as a result of a common-envelope episode in a close binary system (Khouri et al. 2021). Therefore, their characterization requires observations at infrared (or longer) wavelengths.
In this Letter, we present near-infrared spectra of the four radio continuum emitting WFs (IRAS 15445−5449, IRAS 18019−2216, IRAS 18443−0231, and IRAS 18464−0140) and the WF candidate (IRAS 18480+0008) and aim to clarify their nature. We also observed the WF PN IRAS 15103−5754 for comparison purposes.
2. Observations and data processing
We performed long-slit intermediate resolution K-band near-infrared spectroscopy with the New Technology Telescope (NTT) of the European Southern Observatory (ESO) located at the La Silla Observatory in Chile on 11 and 12 June, 2023 (Project ID: 111.24T1.001; P.I.: R. A. Cala). Photometric conditions, average temperatures of +10°C, and a seeing of 2″ were experienced on both nights. To obtain and record the spectra, we used the infrared spectrograph Son of ISAAC (SOFI), a slit of 1″ width, 1.4′ length, the third-order HR grism (resolution of R ≃ 2200 for a 0 6 slit width and wavelength range 2.00–2.30 μm), and the 1024 × 1024 Hawaii HgCdTe array. The position angle of the slit was 0° in all cases except for IRAS 15103−5754, where the slit was oriented along the jet traced by the H2O masers (+56°; Gómez et al. 2015). In order to cancel out the telluric lines, we observed B main-sequence stars after or before each target, making use of the same instrumental setup (see Appendix A).
The spectra of the telluric standard stars and of our targets were processed using the ESO’s SOFI pipeline in esorex, which performed dark-current correction, flat fielding, slit curvature distortion, combination of frames, and wavelength calibration. The dispersion obtained was ∼5 Å pixel−1. The wavelength accuracy is ∼0.004 μm in most of the spectral range and ∼0.01 μm when longer than 2.25 μm. We used IRAF to extract the spectra and clean the bad pixels. We then removed the Brγ absorption line from the telluric standards by interpolating across that part of the spectrum. We then divided the target spectra by the spectra of their corresponding telluric standard in order to cancel out atmospheric absorption features. The absolute flux calibration was carried out by multiplying by a normalized blackbody spectrum at the temperature of the telluric standard, and the result was re-scaled to fit the K-band magnitudes of our targets reported in the Two Micron All Sky Survey (2MASS) and United Kingdom Infrared Deep Sky Survey (UKIDSS). Assuming that the telluric standards are not variable in the infrared, uncertainties of ±5–10% in absolute flux calibration are expected from this method, although taking into account that the slit width could be narrower than the angular size of the observed targets, some emission could be filtered out, and thus larger uncertainties are possible.
3. Results and discussion
Figure 1 shows the spectra of the six observed WFs, and it allowed us to classify the objects into two groups. The sources in the top panels of Fig. 1 (IRAS 18019−2216, IRAS 18464−0140, and IRAS 18480+0008; hereafter Group A) show no emission lines but only absorption features due to the first overtone bandhead of CO (ν = 2–0) at 2.29 μm and CO (ν = 3–1) at 2.31 μm, although the last absorption feature is not detected in IRAS 18019−2216. Weak absorption lines of Na I, Ca I, and Si I at ∼2.20, ∼2.25, and ∼2.26 μm, respectively, are detected in IRAS 18480+0008 and apparently also in IRAS 18464−0140.
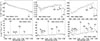 |
Fig. 1. K-band near-infrared spectra of our targets. The top panels contain the objects without emission lines (Group A), and the bottom panels present the objects with emission lines (Group B). Other possible emission lines are are difficult to identify due to the low resolution of the spectra. |
In the sources shown in the bottom panels of Fig. 1 (IRAS 15103−5754, IRAS 15445−5449, and IRAS 18443−0231; hereafter Group B), the spectra are rich in emission lines, and there is no obvious CO absorption. In IRAS 15445−5449, there is emission of the CO (ν = 2–0) bandhead and of the doublet of Na I at 2.206 and 2.209 μm observed around 2.210 μm. In Appendix B and Table B.1, we report fluxes of the emission lines detected in Group B. We note that the spectrum of the WF IRAS 18443−0231 (Fig. 1, bottom-left panel) is consistent with the spectra of this source previously reported in near-infrared surveys (Cooper et al. 2013; Kanarek et al. 2015).
3.1. Evolutionary stage of the objects
The most noticeable spectral features in the spectra of the sources in Group A are the absorption of the CO bands near 2.29 and 2.31 μm. These bands are characteristic of cool (Teff ≃ 2100–5700 K) main-sequence, giant, and supergiant stars of spectral types G, K, and M (Rayner et al. 2009). They are ubiquitous in the spectra of AGB stars and have been detected in some early post-AGB stars (e.g., Hrivnak et al. 1994; Oudmaijer et al. 1995; Kanarek et al. 2015). We also noticed a rising continuum towards longer wavelengths in IRAS 18464−0140 and IRAS 18480+0008.
By comparing the spectra of our Group A sources with those in the atlas of infrared spectra by Rayner et al. (2009), these objects should be M-type giants or supergiants. This is consistent with an AGB or early post-AGB nature. Thus, although the radio continuum emission in the Group A sources indicates the presence of ionized gas, we do not expect this ionization to be due to ultraviolet radiation, as in the case of PNe, but to shocks, as has been previously reported in post-AGB stars (e.g., Cerrigone et al. 2017; Pérez-Sánchez et al. 2017).
The spectra of sources in Group B are dominated by recombination lines of hydrogen (Br γ) and He I as well as H2 emission lines. These lines can be produced both in photoionized nebulae and as a consequence of shocks (Black & Dishoeck 1987; DePoy & Shields 1994; Sutherland & Dopita 2017). Thus, these objects could either be post-AGB stars with shocks or nascent PNe. In any case, they seem more evolved than the sources in Group A, whose spectra indicate cool giant stars.
To investigate whether the observed emission lines trace photoionized gas typical of PNe or shock-excited gas, we used the Mexican Million Models Database (3MdB; Morisset et al. 2015; Alarie & Morisset 2019) and the shock models by Sutherland & Dopita (2017) stored in the 3MdB (for more details see Cala et al. 2024). The diagnostic diagram is shown in Fig. 2 and displays line intensity ratios compatible with shock ionization. Unfortunately, the 3MdB has not yet incorporated the response of the He I 2.120 μm line to photoionization models, and therefore, the corresponding diagram cannot be constructed in this case.
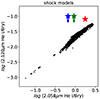 |
Fig. 2. Emission-line ratio diagnostic diagram for recombination lines of Brγ at 2.166 μm and He I lines at 2.058 and 2.120 μm. The region occupied by the black points corresponds to the values expected from the shock models of Sutherland & Dopita (2017). The filled stars are IRAS 15103−5754 (blue), IRAS 15445−5449 (green), and IRAS 18443−0231 (red). The sizes of the symbols are larger than their errors. The arrows indicate upper limits for the flux of the He I 2.120 μm emission line (see Fig. 1 and Table B.1). |
The diagram in Fig. 2 does not provide any constraints to the nature of the emission in IRAS 15103−5754 and IRAS 15445−5449, where the He I at 2.120 μm is not detected in our data. However, we note that the shock-ionization models are distributed along a relatively narrow strip in the diagram, providing a useful prediction of the expected intensity of the He I 2.120 μm emission line. Thus, new, deeper spectra of these sources could shed light on these objects by investigating whether the 2.120 μm He I/Brγ ratio is consistent with shocks.
However, in the case of IRAS 18443−0231, this line ratio seems to be incompatible with shocks alone. This strongly suggests that there should be a significant contribution of photoionization in the observed spectrum of this source. Moreover, the He I emission at 2.058 μm is a factor of ≃2 stronger than the Brγ one, which would be consistent with a photoionized region with log Teff[K] ≤ 4.6 and log ne [cm−3] ≥ 4, according to Figure 2 of DePoy & Shields (1994). In summary, the 2.120 μm He I/Brγ ratio suggests that IRAS 18443−0231 could be a nascent PN whose radio continuum emission is dominated by non-thermal processes, as in IRAS 15103−5754 (Suárez et al. 2015).
3.2. The slow and fast jets in WFs
Water fountains are usually identified in single-dish spectra of H2O maser emission when they show components spread over a velocity range larger than that expected from the expansion of the AGB envelope (≃50 km s−1, assuming maximum expansion velocity ≃25 km s−1; e.g., te Lintel Hekkert et al. 1991). However, another criterion commonly used for WF identification is that the H2O maser components fall outside the velocity range covered by OH masers (Yung et al. 2013; Fan et al. 2024) since this is considered to be an indication of the presence of non-spherical mass loss. This is based on the fact that in the case of maser emission in spherical AGB envelopes, H2O masers are pumped at distances closer to the star than OH masers. Therefore, their velocities must be lower, with OH masers tracing the terminal velocities of the outer envelope. Similarly, the comparison of the velocity ranges of other lines, such as the OH main lines (1665 and 1667 MHz) with respect to the satellite line (1612 MHz) have been used to infer the presence of non-spherical mass loss (Xie et al. 2025). In the case of WFs, sources with H2O maser emission that have low-velocity spreads (< 50 km s−1) but fall outside the range of OH velocities have been classified as low-velocity WFs (Yung et al. 2013). Moreover, independent of the characteristics of OH emission, one could also classify as low-velocity WFs sources whose H2O maser emission shows low-velocity spreads, but it has been seen to trace bipolar jets when observed with radio interferometers (e.g., Boboltz & Marvel 2005). These slow jets traced by H2O masers have been interpreted in some cases as a projection effect, occurring when the jet axis is close to the plane of the sky (Boboltz & Marvel 2005; Vlemmings et al. 2014). However, Yung et al. (2013) found four candidate low-velocity WFs whose infrared colors resemble those of AGB stars and are clearly different from classical high-velocity WFs, whose colors are typical of post-AGB stars. Based on that finding, Yung et al. (2013) suggested that these low-velocity WFs are transitional objects in the late AGB or early post-AGB phase and that their jets are intrinsically slower than those of high-velocity WFs.
Cala et al. (2025) presented maps of the H2O maser distribution of the three evolved stars of Group A in this paper: IRAS 18019−2216, IRAS 18464−0140, and IRAS 18480+0008. The first two objects clearly present a linear distribution of the H2O maser emission, indicating the presence of jets with radial velocity spreads of only ≤30 km s−1. Thus, the authors classified them as low-velocity WFs. The H2O maser distribution in IRAS 18480+0008 also suggests a jet, but higher-resolution observations are necessary for confirmation, so we can consider it a candidate low-velocity WF. However, the sources in Group B are classical high-velocity WFs, since the reported velocity spreads of the H2O maser emission in Group B (IRAS 15103−5754, IRAS 15445−5449, and IRAS 18443−0231) has been reported to be 70, 90, and 80 km s−1, respectively (Pérez-Sánchez et al. 2013; Gómez et al. 2015; Cala et al. 2025).
The clear differences in the infrared spectra of the Group A sources with respect to the classical high-velocity WFs of Group B (Fig. 1) strongly suggest that the difference between low- and high-velocity WFs is not necessarily due to a projection effect (although it could be possible in particular cases). Instead, they are intrinsically different objects in different evolutionary phases. This aligns with the suggestion put forward by Yung et al. (2013, see above), but we provide a stronger support based on spectroscopy. Moreover, our results may indicate a possible evolution of the ejection velocity of jets in evolved stars, which increases as the post-AGB evolution proceeds.
We note, however, that there is a potential bias in our sample since all three sources in our Group B present non-thermal radio continuum emission and evidence of the presence of ionized gas (due to the detection of infrared recombination lines). These properties might not be shared by all known high-velocity WFs. Extending our spectroscopic study to a larger sample of WFs would help confirm the evolutionary trends suggested in this work.
3.3. Origin of the CO and Na I emission in IRAS 15445−5449
Notably, IRAS 15445−5449 is the only source in our sample that shows the CO band and Na I doublet in emission. The CO band emission has been found in several post-AGB stars, which has been interpreted in some cases as tracing ongoing mass loss (e.g., Hrivnak et al. 1994). In the WF IRAS 16342−3814 (Claussen et al. 2009), the CO band and Na I doublet are both observed in emission (Gledhill & Forde 2012), as in IRAS 15445−5449. These features originate from an unresolved region around the central star of IRAS 16342−3814 and seem to be scattered toward our line of sight by dust in the nebula. Gledhill & Forde (2012) suggested that this emission may also arise from a circumstellar disk, which is analogous to what has been observed in young stellar objects (e.g., Martin 1997; Fedriani et al. 2020). The maser jet in IRAS 15445−5449 (Pérez-Sánchez et al. 2013) suggests the presence of both a circumstellar accretion disk and active mass loss, which could be the origin of the CO band and Na I doublet. Further high-resolution observations can help unravel the spatial location and nature of this emission in IRAS 15445−5449.
4. Conclusions
We have presented near-infrared spectra of six objects with WF characteristics and radio continuum emission. The aim of our observations was to unveil their evolutionary stage. The main conclusions of this paper are outlined as follows:
-
The objects IRAS 18019−2216, IRAS 18464−0140, and IRAS 18480+0008 exhibit CO absorption bands characteristic of cool (Teff ≃ 2100 − 5700 K) giant stars, while IRAS 15103−5754, IRAS 15445−5449, and IRAS 18443−0231 show H2, Brγ, and He I emission lines consistent with shocks around post-AGB stars or photoionization from PNe. In particular, the emission line ratios in IRAS 18443−0231 indicate that it may have entered the photoionization phase and may be a nascent PN.
-
The three WFs classified as giant stars are low-velocity WFs, while the other three are classical high-velocity WFs, which strongly suggests that the difference between low- and high- velocity WFs reflects intrinsically different evolutionary stages. Moreover, the combined spectral characteristics and maser kinematics support the idea that the ejection velocity of jets is higher for more evolved post-AGB stars than for younger ones.
-
The spectrum of IRAS 15445−5449 shows the CO band in emission and Na I emission lines, suggesting the presence of a circumstellar disk and/or active mass loss.
These findings provide new spectroscopic evidence linking the velocity of WF jets to the evolutionary stages of their central stars. Future studies should extend the spectroscopic analysis to a larger sample of WFs, ideally complemented by high angular resolution imaging and maser monitoring, to confirm the proposed evolutionary sequence.
The project is defined in Lawrence et al. (2007) and uses the UKIRT Wide Field Camera (Casali et al. 2007) and a photometric system described in Hewett et al. (2006). The pipeline processing and science archive are described in Hambly et al. (2008))
IRAF is distributed by the National Optical Astronomy Observatories, which is operated the Association of Universities for Research in Astronomy, Inc., under contract to the National Science Foundation.
Acknowledgments
We are very grateful to our anonymous referee for their constructive comments that have improved the paper. Based on observations collected at the European Organisation for Astronomical Research in the Southern Hemisphere under ESO programme(s) 111.24T1.001. This publication makes use of data products from the 2MASS, which is a joint project of the University of Massachusetts and the Infrared Processing and Analysis Center/California Institute of Technology, funded by the National Aeronautics and Space Administration and the National Science Foundation, and UKIDSS. RAC, LFM, JFG are supported by grants PID2023-146295NB-I00 and CEX2021-001131-S, funded by MCIN/AEI /10.13039/501100011033. RAC also acknowledges support by the predoctoral grant PRE2018-085518, funded by MCIN/AEI/ 10.13039/501100011033 and by ESF Investing in your Future. K.O. acknowledges the support of the Agencia Nacional de Investigación Científica y Desarrollo (ANID) through the FONDECYT Regular grant 1240301.
References
- Alarie, A., & Morisset, C. 2019, Rev. Mex. Astron., 55, 377 [Google Scholar]
- Black, J. H., & Dishoeck, E. F. 1987, ApJ, 322, 412 [Google Scholar]
- Boboltz, D. A., & Marvel, K. B. 2005, ApJ, 627, 45 [Google Scholar]
- Cala, R. A., Gómez, J. F., Miranda, L. F., et al. 2022, MNRAS, 516, 2235 [CrossRef] [Google Scholar]
- Cala, R. A., Miranda, L. F., Gómez, J. F., et al. 2024, A&A, 691, A321 [NASA ADS] [CrossRef] [EDP Sciences] [Google Scholar]
- Cala, R. A., Gómez, J. F., Miranda, L. F., et al. 2025, A&A, in press, https://doi.org/10.1051/0004-6361/202452213 [Google Scholar]
- Casali, M., Adamson, A., Alves de Oliveira, C., et al. 2007, A&A, 467, 777 [NASA ADS] [CrossRef] [EDP Sciences] [Google Scholar]
- Cerrigone, L., Umana, G., Trigilio, C., et al. 2017, MNRAS, 468, 3450 [CrossRef] [Google Scholar]
- Claussen, M. J., Sahai, R., & Morris, M. R. 2009, ApJ, 691, 219 [Google Scholar]
- Cooper, H. D. B., Lumsden, S. L., Oudmaijer, R. D., et al. 2013, MNRAS, 430, 1125 [NASA ADS] [CrossRef] [Google Scholar]
- Day, F. M., Philström, Y. M., Claussen, M. J., et al. 2010, ApJ, 713, 986 [NASA ADS] [CrossRef] [Google Scholar]
- DePoy, D. L., & Shields, J. C. 1994, ApJ, 422, 187 [Google Scholar]
- Fan, H., Nakashima, J. I., Engels, D., et al. 2024, ApJS, 270, 13 [Google Scholar]
- Fedriani, R., Caratti o Garatti, A., Koutoulaki, M., et al. 2020, A&A, 633, A128 [NASA ADS] [CrossRef] [EDP Sciences] [Google Scholar]
- Gledhill, T. M., & Forde, K. P. 2012, MNRAS, 421, 346 [NASA ADS] [Google Scholar]
- Gómez, J. F., Rizzo, R., Suárez, O., Miranda, L. F., et al. 2011, ApJ, 739, L14 [Google Scholar]
- Gómez, J. F., Suárez, O., Bendjoya, P., et al. 2015, ApJ, 799, 186 [CrossRef] [Google Scholar]
- Gómez, J. F., Suárez, O., Rizzo, J. R., et al. 2017, MNRAS, 468, 2081 [Google Scholar]
- Hambly, N. C., Collins, R. S., Cross, N. J. G., et al. 2008, MNRAS, 384, 637 [NASA ADS] [CrossRef] [Google Scholar]
- Hewett, P. C., Warren, S. J., Leggett, S. K., et al. 2006, MNRAS, 367, 454 [NASA ADS] [CrossRef] [Google Scholar]
- Hrivnak, B. J., Kwok, S., Geballe, T. R., et al. 1994, ApJ, 420, 783 [Google Scholar]
- Imai, H., Obara, K., Diamond, P. J., et al. 2002, Nature, 417, 829 [NASA ADS] [CrossRef] [Google Scholar]
- Imai, H., Nakashima, J.-I., Diamond, P. J., et al. 2005, ApJ, 622, L125 [NASA ADS] [CrossRef] [Google Scholar]
- Kanarek, G., Shara, M., Faherty, J., et al. 2015, MNRAS, 452, 2858 [NASA ADS] [CrossRef] [Google Scholar]
- Khouri, T., Vlemmings, W. H. T., Tafoya, D., et al. 2021, Nat. Astron., 6, 275 [NASA ADS] [CrossRef] [Google Scholar]
- Lawrence, A., Warren, S. J., Almaini, O., et al. 2007, MNRAS, 379, 1599 [Google Scholar]
- Martin, S. C. 1997, ApJ, 478, 33 [Google Scholar]
- Morisset, C., Delgado-Inglada, G., & Flores-Fajardo, N. 2015, Rev. Mex. Astron., 51, 101 [Google Scholar]
- Orosz, G., Gómez, J. F., Imai, H., et al. 2019, MNRAS, 482, L40 [Google Scholar]
- Oudmaijer, R. D., Waters, L. B. F. M., van der Veen, W. E. C. J., et al. 1995, A&A, 299, 69 [Google Scholar]
- Pérez-Sánchez, A. F., Vlemmings, W. H. T., Tafoya, D., et al. 2013, MNRAS, 436, L79 [NASA ADS] [CrossRef] [Google Scholar]
- Pérez-Sánchez, A. F., Tafoya, D., García López, R., et al. 2017, A&A, 601, A68 [NASA ADS] [CrossRef] [EDP Sciences] [Google Scholar]
- Rayner, J. T., Cushing, M. C., & Vacca, W. D. 2009, ApJS, 185, 289 [Google Scholar]
- Suárez, O., Gómez, J. F., & Miranda, L. F. 2008, ApJ, 689, 430 [CrossRef] [Google Scholar]
- Suárez, O., Gómez, J. F., Bendjoya, P., et al. 2015, ApJ, 806, 105 [CrossRef] [Google Scholar]
- Sutherland, R. S., & Dopita, M. A. 2017, ApJS, 229, 34 [Google Scholar]
- Tafoya, D., Imai, H., Gómez, J. F., et al. 2020, ApJ, 890, L14 [NASA ADS] [CrossRef] [Google Scholar]
- te Lintel Hekkert, P., Caswell, J. L., Habing, H. J., et al. 1991, A&AS, 90, 327 [NASA ADS] [Google Scholar]
- Uscanga, L., Imai, H., Gómez, J. F., et al. 2023, ApJ, 948, 17 [Google Scholar]
- Vlemmings, W. H. T., Amiri, N., & van Langevelde, H. J. 2014, A&A, 569, A92 [NASA ADS] [CrossRef] [EDP Sciences] [Google Scholar]
- Xie, J.-Y., Nakashima, J.-I., & Zhang, Y. 2025, ApJ, 978, 114 [Google Scholar]
- Yung, B. H. K., Nakashima, J.-I., Imai, H., et al. 2011, ApJ, 741, 94 [Google Scholar]
- Yung, B. H. K., Nakashima, J.-I., Imai, H., et al. 2013, ApJ, 769, 20 [NASA ADS] [CrossRef] [Google Scholar]
Appendix A: Parameters of the observations
The K-broadband magnitudes of the targets were taken from the Two Micron All Sky Survey (2MASS) and the United Kingdom Infrared Deep Sky Survey (UKIDSS 1). The targets and parameters of the performed observations are shown in Table A.1.
The small angular size of the targets allowed the creation of sky and target frames simultaneously by jittering (20″ randomly) and nodding (80″ along the slit) the NTT around the target position, without the need of further offset observations of the sky.
In order to favor the detection of weak emission lines, the Hawaii array was configured in non-destructive mode to take 30 readings per exposure and 4 samples per reading. The detector integration time (DIT) and the number of frames (NDIT) per jittered position were chosen depending on the broadband K magnitude of the target, night-time conditions, and field crowding. All targets were observed at least 2 NDIT per jittered position to enhance the signal-to-noise ratio of the emission.
Parameters of the near-infrared K-band spectroscopic observations.
Appendix B: Emission line fluxes of Group B sources
In Table B.1 we report the emission line fluxes in the spectra of Group B: IRAS 15103−5754, IRAS 15445−5449, and IRAS 18443−0231 (Fig. 1). These values have been obtained by fitting gaussians following standard procedures in the software IRAF2.
Emission line fluxes, F(λ), in units of F(Brγ) = 100 in the spectra of Group B sources.
All Tables
Emission line fluxes, F(λ), in units of F(Brγ) = 100 in the spectra of Group B sources.
All Figures
|
Fig. 1. K-band near-infrared spectra of our targets. The top panels contain the objects without emission lines (Group A), and the bottom panels present the objects with emission lines (Group B). Other possible emission lines are are difficult to identify due to the low resolution of the spectra. |
| In the text | |
|
Fig. 2. Emission-line ratio diagnostic diagram for recombination lines of Brγ at 2.166 μm and He I lines at 2.058 and 2.120 μm. The region occupied by the black points corresponds to the values expected from the shock models of Sutherland & Dopita (2017). The filled stars are IRAS 15103−5754 (blue), IRAS 15445−5449 (green), and IRAS 18443−0231 (red). The sizes of the symbols are larger than their errors. The arrows indicate upper limits for the flux of the He I 2.120 μm emission line (see Fig. 1 and Table B.1). |
| In the text | |
Current usage metrics show cumulative count of Article Views (full-text article views including HTML views, PDF and ePub downloads, according to the available data) and Abstracts Views on Vision4Press platform.
Data correspond to usage on the plateform after 2015. The current usage metrics is available 48-96 hours after online publication and is updated daily on week days.
Initial download of the metrics may take a while.