| Issue |
A&A
Volume 703, November 2025
|
|
|---|---|---|
| Article Number | L14 | |
| Number of page(s) | 5 | |
| Section | Letters to the Editor | |
| DOI | https://doi.org/10.1051/0004-6361/202557130 | |
| Published online | 18 November 2025 | |
Letter to the Editor
Mass-loading of outflows from evolving young massive clusters
1
Max-Planck-Institut für Kernphysik, Saupfercheckweg 1, D-69117 Heidelberg, Germany
2
Zentrum für Astronomie der Universität Heidelberg, Astronomisches Rechen-Institut, Mönchhofstr. 12-14, 69120 Heidelberg, Germany
3
Max-Planck-Institut für Astronomie, Königstuhl 17, D-69117 Heidelberg, Germany
4
Space Telescope Science Institute, 3700 San Martin Drive, Baltimore, MD 21218, USA
5
Astronomy & Astrophysics Section, School of Cosmic Physics, Dublin Institute for Advanced Studies, DIAS Dunsink Observatory, Dublin D15 XR2R, Ireland
6
Universität Heidelberg, Interdisziplinäres Zentrum für Wissenschaftliches Rechnen, 69120 Heidelberg, Germany
⋆ Corresponding author: This email address is being protected from spambots. You need JavaScript enabled to view it.
Received:
6
September
2025
Accepted:
14
October
2025
Abstract
Feedback from young massive stellar clusters (YMCs) is an important driver of galaxy evolution. In the first few Myr, mechanical feedback is dominated by the collective effects of the massive stellar winds in the YMC. The mass-loss rates (Ṁ) and terminal wind velocities of these stars change by orders of magnitude as the massive stars evolve, and Ṁ of red supergiant (RSG) stars in particular are uncertain by a factor ∼20 or more. In this work we performed a first study of the time evolution of the average cluster wind velocity (¯Vcl) as a function of the stellar metallicity (Z), assuming single star evolution. We also verified the validity of assuming Wolf-Rayet (WR) stars dominate the feedback effects of a YMC, as often done when interpreting X-ray and γ-ray observations, and tested how sensitive ¯Vcl is to current uncertainties in Ṁ. We used PYSTARBURST99 to calculate integrated properties of YMCs for Z in the range 0.0004−0.02, which encompasses the range of environments from IZw18 to the Galactic centre. We find that ¯Vcl drops off rapidly for sub-Large Magellanic Cloud Z values, and we recommend that a value of 500−1000 km s−1 be used in this regime. We show that accounting only for WR stars can overestimate ¯Vcl by 500−2000 km s−1 at Z ≥ ZLMC. We also find that different RSG Ṁ assumptions can change the inferred ¯Vcl by ∼1000 km s−1, highlighting the need for improved observational constraints for RSGs in YMCs.
Key words: circumstellar matter / stars: massive / stars: mass-loss / supergiants / stars: winds / outflows / galaxies: star clusters: general
© The Authors 2025
 Open Access article, published by EDP Sciences, under the terms of the Creative Commons Attribution License (https://creativecommons.org/licenses/by/4.0), which permits unrestricted use, distribution, and reproduction in any medium, provided the original work is properly cited.
This article is published in open access under the Subscribe to Open model.
Open Access funding provided by Max Planck Society.
1. Introduction
Young massive stellar clusters (YMCs) are key drivers of stellar feedback in galaxies; they host the majority of the massive stars that mediate this feedback via strong winds during both their lifetimes and their deaths as core-collapse supernovae (CCSNe; e.g. Portegies Zwart et al. 2010). They are commonly found in energetic environments such as luminous infrared and starburst galaxies, and with the advent of JWST there is a wealth of new observations for YMCs and their feedback across a range of metallicities (Z; e.g. Linden et al. 2024; Kader et al. 2025; Correnti et al. 2025).
Feedback from CCSNe begins after only a few Myr. The start time is uncertain as ‘explodability’ depends on multiple stellar structure variables (e.g. Burrows et al. 2024; Maltsev et al. 2025), themselves strongly influenced by Z-dependent evolutionary effects. Fichtner et al. (2024) studied feedback from a large grid of stellar evolution calculations, using the SN explodability and explosion energy prescription of Schneider et al. (2021) for low-Z stellar populations. They found that CCSNe begin to dominate the initial mass function (IMF) weighted mechanical luminosity after 5 Myr in all cases; more massive stars that have shorter lifetimes than this are not predicted to explode.
Pre-SN feedback depends greatly on the individual stellar mass-loss rates (Ṁ) and terminal wind velocities (v∞), both of which vary by orders of magnitude for massive stars during post-main-sequence evolution. The O and Wolf-Rayet (WR) stars drive a collective outflow with their hot, powerful winds, which are sensitive to Z as well (e.g. Sander et al. 2020; Hawcroft et al. 2024). Cool supergiants (CSGs) have much slower winds but similar or higher Ṁ (e.g. Yang et al. 2023). While there is good correspondence between wind prescriptions for OB and WR stars, underpinned by detailed theory, this is not the case for CSGs. The lack of a coherent theory for CSG Ṁ, and difficulties in direct measurements lead to large uncertainties (e.g. Beasor et al. 2020; Antoniadis et al. 2025; Bronner et al. 2025), with different assumptions having drastic consequences on both the subsequent stellar evolution and feedback (Merritt et al. 2025). Values for v∞ are comparatively well constrained and are only weakly dependent on Z (Hawcroft et al. 2024).
Pre-SN YMC feedback depends on individual stellar winds collectively driving a cluster wind with average velocity  , total mechanical velocity Lmech, tot, and total mass-loss rate Ṁcl. Cantó et al. (2000) presented an analytic model for
  assuming maximally efficient wind-wind interactions and mass-loading from individual stars, based on the model Chevalier & Clegg (1985) developed for starburst galaxies. Stevens & Hartwell (2003) compared expected cluster wind properties with X-ray observations using a similar approach. Following Cantó et al. (2000) and Stevens & Hartwell (2003), we can express
  as
as
 (1)
(1)
 is often used to approximate the cluster wind velocity field when modelling X-ray and γ-ray emission from YMCs and their immediate surroundings (e.g. Morlino et al. 2021; Albacete-Colombo et al. 2023; Härer et al. 2023; Webb et al. 2024; Haubner et al. 2025). In these cases, it is often assumed that Lmech, tot ≈ Lmech, WR, the mechanical luminosity of the WR population, and thus the value of
  only takes this population into account, neglecting mass-loading from other stars. Recent local-scale (magneto)hydrodynamic simulations of YMCs with individually resolved stars (e.g. Badmaev et al. 2022; Vieu et al. 2024; Härer et al. 2025) have been focussed on the dynamics on parsec scales and the ability to accelerate particles to (very) high energies, therefore largely neglecting the winds of cool, evolved stars. Mass-loading of a hot, fast cluster wind through mixing with the cool, slow wind of a single red supergiant (RSG) was studied by Larkin et al. (2025), and their results align with observations of the RSGs in Westerlund 1 (Guarcello et al. 2025).
Given the high temperatures and low densities of cluster winds, there is a lack of direct  observations. Only the flow speed in the core is indirectly constrained: it should not significantly exceed the adiabatic sound speed, as inferred from diffuse X-ray observations. There is some tension between these values and the
  values predicted by theory, which tend to be a factor of ∼2 higher (Stevens & Hartwell 2003; Härer et al. 2023; Larkin et al. 2025). More direct measurements of
  could be done where CSG and cluster winds interact through balancing with ram pressure (e.g. Povich et al. 2008; Larkin et al. 2025).
Despite the known strong variations in both Ṁ and v∞ as a function of Z, and the importance of YMC feedback in the low-Z early Universe, no studies to date have examined the variation in cluster wind properties with Z. In this work we used population synthesis to (a) compare  and Lmech, tot for a range of Z, (b) compare estimates of
  taking only WR stars into account versus taking a complete stellar population into account, and (c) test how sensitive
  is to the choice of stellar wind prescription, with a focus on CSGs. We did not consider SNe in this work as we focussed on the earliest stages of YMC lifetimes, before SNe become dominant for YMC feedback.
Our paper is organised as follows: In Sect. 2 we describe our framework and stellar wind prescriptions. In Sect. 3 we describe Z-dependent trends in Vcl and Lmech, tot for YMCs (Sect. 3.1), differences in Vcl for complete stellar populations compared to only WR stars (Sect. 3.2), and the influence of different stellar wind prescriptions on Vcl (Sect. 3.3). We discuss our findings and present our conclusions in Sect. 4.
2. Methods
2.1. pySTARBURST99
In this work we used PYSTARBURST99, hereafter PYSB (Hawcroft et al. 2025), which is an updated version of STARBURST99 (Leitherer et al. 1999, 2014), a population synthesis code intended for calculating the integrated properties of a starburst galaxy. This code calculates values such as Lmech, tot and Ṁcl for a single coeval stellar population of a given Z.
For all populations modelled here, we used Mtot = 1 × 10⁵ M⊙ and a maximum initial stellar mass (Minit) of 120 M⊙. We calculated models for all Z values in PYSB except zero. These represent Z typical of the Galactic centre (ZMWC = 0.02), the Galaxy (ZMW = 0.014), and the Large and Small Magellanic Clouds (ZL/SMC = 0.006, 0.002) and IZw18 (ZIZw18 = 0.0004). For each Z, we adopted the non-rotating evolutionary tracks. Using model parameters from these tracks, at each timestep we assigned each star to a stellar class, following those used in PYSB:
-
Luminous blue variable (LBV): 3.75 < log10Teff < 4.4 & log10 Ṁ > −3.5.
-
CSG: log10Teff < 3.9 and not an LBV.
-
WR: log10Teff > 4.4 and surface H abundance < 0.4.
-
OB: Remaining stars with log10Teff > 3.9.
New RSG Ṁ prescriptions were applied to CSGs where log10Teff < 3.7 and Minit > 8 M⊙, with the remaining CSG Ṁ left at default values. This matches where RSG Ṁ is used in the evolutionary models. Stars with a Minit less than 7 M⊙ do not lose mass on the main sequence in these evolutionary tracks, so these filters cover all stars that are relevant for this work.
2.2. Stellar wind prescriptions
PYSB includes a default wind prescription (referred to here as ‘base’) and options for using Ṁ rates from Vink & Sander (2021) or Björklund et al. (2021), or the v∞ relation from Hawcroft et al. (2024) for the main-sequence OB stars, referred to as Vink, Leuven and XShootU respectively as in Hawcroft et al. (2025). We also added the Ṁ prescriptions from Sander & Vink (2020) and Sander et al. (2023, hereafter, the Sander prescription) for WRs. Given the large number of possible RSG wind prescriptions (see Yang et al. 2023; Decin et al. 2024, and references therein), we implemented recent examples of a low (Beasor et al. 2020, 2023) and a high (Yang et al. 2023) Ṁ rate. We did not include the theoretically motivated prescription from Kee et al. (2021) given the range of possible Ṁ values for reasonable turbulent velocity choices (Merritt et al. 2025). The effects of the alternative Ṁ prescriptions on the stellar evolution were not accounted for, and so the positions on the Hertzsprung-Russell diagram may not be consistent at all times.
3. Results
3.1. Metallicity trends for Lmech, tot and Vcl
In Fig. 1 we show Lmech, tot and  for different Z. The upper panel shows a consistent Lmech, tot trend. The variation is smooth during the pre-WR phase until ∼2.5 Myr. At this time, Lmech, tot increases for the Milky Way (MW) centre, MW, and Large Magellanic Cloud (LMC) populations due to the effects of WR stars. These effects are weaker at ZSMC and lower, as the stellar evolution tracks (which are themselves Z-dependent) produce few or no WR stars as defined in PYSB. We discuss this effect in Appendix A. Peak Lmech, tot occurs at ∼3 Myr in all cases except the Small Magellanic Cloud (SMC), and decreases rapidly as WR stars die off, as shown in Hawcroft et al. (2024).
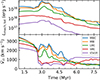 |
Fig. 1. Time evolution of Lmech, tot (upper panel) and |

The lower panel shows a qualitatively consistent trend of a slowly decreasing  until ∼2.5 Myr. This is where evolved massive stars begin to affect the population, and there is a clear separation from this time forwards. For the higher-Z populations, the
  increases due to WR stars, whereas at lower Z, the
  falls off rapidly due to increased mass-loading from cool evolved stars, which is not offset by powerful WR winds.
3.2. Effects of complete stellar populations
In Fig. 2 we show Lmech, tot and  for ZLMC and higher, where single WR stars are relevant. The upper panel validates the canonical assumption that Lmech, tot ≈ Lmech, WR. This is generally true for the time when WR stars are active, with a gradual divergence at later times for the LMC population in particular. When active, WR stars account for ∼80% of Lmech, tot, with the OB stars contributing almost the entirety of the remainder.
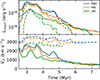 |
Fig. 2. Time evolution of Lmech (upper panel) and |

In the lower panel, we see the effects of mass-loading from non-WR stars in these populations. When we consider only WR stars, the Vcl is ∼2500 − 3500 km s−1 over the time period they are present. When we include all stars, there is an initial peak in Vcl from WR winds of ∼2500 − 3000 km s−1, which rapidly falls off. From ∼4 Myr, WR stars begin to die off and cool evolved stars become active. This leads to Lmech, tot decreasing and Ṁcl increasing simultaneously, and thus  falls off. Even for early times, the WR-only
  exceeds that of the full population by > 500 km s−1. By ∼4 − 5 Myr, the age typically assumed for the prototypical Galactic YMC Westerlund 1, the difference increases to ∼1500 km s−1. This is because WR stars do not dominate Ṁcl as they do Lmech, tot for the time they are active – the WR Ṁ is typically 30% of the total Ṁ and never exceeds 60% of it. We show how different stellar classes contribute to Lmech, tot and Ṁcl over time for Galactic Z in Fig. 3.
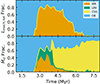 |
Fig. 3. Time evolution of the relative contribution of each stellar class to the total Lmech, tot (upper panel) and Ṁcl (lower panel) for ZMW. |
3.3. Cluster wind sensitivities to different prescriptions
We next studied the effects of different stellar wind prescriptions all at ZMW. For the OB regime we used the PYSB default options of Vink & Sander (2021), Björklund et al. (2021), and Hawcroft et al. (2024). For WRs we added the Sander prescription, and for RSGs the Beasor et al. (2020) and Yang et al. (2023) prescriptions. The  is relatively insensitive to most changes among the considered OB and WR prescriptions, and we show these effects in Appendix A. In Fig. 4 we show the effects of using the Ṁ prescriptions of Beasor et al. (2020) and Yang et al. (2023) on
  for ZMW.
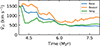 |
Fig. 4. Time evolution of |

Between ∼4 and 5.5 Myr the difference in Vcl from changes in assumptions regarding the RSG Ṁ is of the order of 500 − 1000 km s−1. These prescriptions are independent of Z, and in general the RSG Ṁ does not strongly depend on Z (e.g. Beasor et al. 2020; Antoniadis et al. 2025). Thus, CSG mass-loading is likely consequential for YMCs in general.
4. Discussion and conclusions
In this work we present a first estimate of the effects of stellar evolution on the  of a YMC wind. There are some effects we have not considered that are believed to also play a role. We used the formalism from Cantó et al. (2000) – which assumes the stellar winds interact with maximum efficiency, producing a uniform cluster wind – and we did not account for IMF stochastic effects either. Some parts of the cluster wind can move faster, and the velocity profile is expected to deviate from spherical symmetry (Härer et al. 2023; Vieu et al. 2024). YMCs are embedded in their parent molecular cloud until around 1 Myr and expel the leftover natal gas in this time frame (Portegies Zwart et al. 2010); we did not account for this either. This leftover material will mass-load the cluster wind at early times, reducing the
  .
.
We also assumed only single star evolution. Most massive stars will experience some binary interaction over their lifetime (e.g. Sana et al. 2012), leading to effects that would both increase Lmech, tot (binary stripped WR-like stars) and increase mass-loading (e.g. ejection of common envelopes and luminous red novae). The net result of these competing effects is unclear. We adopted Minit = 120 M⊙. Very massive stars (VMS) above this limit are likely important for 1−2 Myr but will have died off by the time the winds of WRs and CSGs become important (Sabhahit et al. 2022). We also did not consider the effects of SNe. It is not clear whether stars above ∼30 M⊙ explode or what dependence this maximum SN mass may have on Z and Ṁ prescriptions. We only considered single stellar populations (SSPs). Given the expected sensitivity to the number, initial masses, and ages of sub-populations, we defer this to future work, where we will also include binarity, VMSs, and SNe.
Nevertheless, we derived important insights from our study. It is clear that assuming only WR stars contribute to Ṁcl can lead to overestimations of  , and that significant quantities of material expelled in cooler stages will be present for all times that WR stars are active. In a sufficiently populated cluster, Ṁcl will never be dominated only by WR stars (unlike Lmech, tot), so our general trend should hold even when assuming different wind prescriptions. Morlino et al. (2021) assumed a
  of 3000 km s−1 when studying the acceleration of PeV energy cosmic rays by YMC cluster winds, which is likely an overestimate for Galactic YMCs older than ∼2 Myr. Alternatively, CCSNe could accelerate up to these energies (e.g. Vieu & Reville 2023; Härer et al. 2025).
The qualitative difference in  between ZLMC and ZSMC is important for interpreting feedback from observations. At high Z, when we considered all contributors, our findings are in broad agreement with currently used values (e.g. Kader et al. 2025). However, for ZSMC and below, it is clear that a
  of ∼500−1000 km s−1 is more appropriate in the pre-SN feedback regime before ∼5−10 Myr (Schneider et al. 2021). The sensitivity of our results to CSG Ṁ assumptions underlines the need for empirical measurements not affected by dust-to-gas ratio assumptions in a range of environments (Beasor et al. 2020; Decin et al. 2024), for example via ram-pressure balancing as proposed by Larkin et al. (2025). CSG mass-loading likely impedes YMC outflows across all Z. Yet, current galaxy evolution simulations struggle to resolve individual stellar feedback as the typical cell resolutions are a few M⊙ (e.g. Lahén et al. 2025). We conclude:
-
The average cluster wind velocity (
 ) is strongly dependent on Z, with the biggest difference obtained between ZLMC and ZSMC. We advise assuming a
  of ∼500−1000 km s−1 for clusters at ZSMC and lower.
 -
By the time SNe start dominating the energetics of stellar feedback from clusters (∼5−10 Myr), the stellar wind Lmech cannot drive a cluster wind with a
 km s−1, at least for the SSPs studied here and for Z ≥ ZLMC.
 -
Our findings support the canonical assumption that Lmech, tot can be well approximated by assuming only the WR stars of a cluster contribute, but we find that the Ṁ from CSGs mass-load the cluster wind and can slow
 by 500 − 2000 km s−1.
 -
 is particularly sensitive to current uncertainties in CSG Ṁ prescriptions. We find that changes in RSG prescriptions produce differences of the order of 1000 km s−1 in
  , highlighting the impact of uncertainties in RSG Ṁ rates on understanding feedback from YMCs for all Z.
Acknowledgments
CJKL gratefully acknowledges support from the International Max Planck Research School for Astronomy and Cosmic Physics at the University of Heidelberg in the form of an IMPRS PhD fellowship. RRL, AACS, and CJKL are supported by the Deutsche Forschungsgemeinschaft (DFG, German Research Foundation) in the form of an Emmy Noether Research Group – Project-ID 445674056 (SA4064/1-1, PI Sander). This project was co-funded by the European Union (Project 101183150 – OCEANS). This research has made use of the Astrophysics Data System, funded by NASA under Cooperative Agreement 80NSSC21M00561. This study used these software packages: Numpy (Harris et al. 2020), matplotlib (Hunter 2007). The authors thank B. Reville, C. Leitherer and N. Lahén for comments on the manuscript and the anonymous referee for their constructive feedback which has improved the manuscript. We also thank the organisers of the Topical Overview on Star Cluster Astrophysics workshop, where parts of this work were conceived. Contributions. CJKL led the project and modified PYSB to include the new stellar wind prescriptions. CH developed PYSB and assisted with modifications. CJKL and JM conceived the project. RRL, LH and AACS provided theoretical support for the project. All authors contributed to drafting the manuscript.
References
- Albacete-Colombo, J. F., Drake, J. J., Flaccomio, E., et al. 2023, ApJS, 269, 14 [NASA ADS] [CrossRef] [Google Scholar]
- Antoniadis, K., Zapartas, E., Bonanos, A. Z., et al. 2025, A&A, 702, A178 [NASA ADS] [CrossRef] [EDP Sciences] [Google Scholar]
- Badmaev, D. V., Bykov, A. M., & Kalyashova, M. E. 2022, MNRAS, 517, 2818 [NASA ADS] [CrossRef] [Google Scholar]
- Beasor, E. R., Davies, B., Smith, N., et al. 2020, MNRAS, 492, 5994 [Google Scholar]
- Beasor, E. R., Davies, B., Smith, N., et al. 2023, MNRAS, 524, 2460 [Google Scholar]
- Björklund, R., Sundqvist, J. O., Puls, J., & Najarro, F. 2021, A&A, 648, A36 [EDP Sciences] [Google Scholar]
- Bronner, V. A., Laplace, E., Schneider, F. R. N., & Podsiadlowski, P. 2025, A&A, 703, A61 [NASA ADS] [CrossRef] [EDP Sciences] [Google Scholar]
- Burrows, A., Wang, T., & Vartanyan, D. 2024, ApJ, 964, L16 [NASA ADS] [CrossRef] [Google Scholar]
- Cantó, J., Raga, A. C., & Rodríguez, L. F. 2000, ApJ, 536, 896 [CrossRef] [Google Scholar]
- Chevalier, R. A., & Clegg, A. W. 1985, Nature, 317, 44 [Google Scholar]
- Correnti, M., Bortolini, G., Dell’Agli, F., et al. 2025, ApJ, 990, 72 [Google Scholar]
- Decin, L., Richards, A. M. S., Marchant, P., & Sana, H. 2024, A&A, 681, A17 [NASA ADS] [CrossRef] [EDP Sciences] [Google Scholar]
- Fichtner, Y. A., Mackey, J., Grassitelli, L., Romano-Díaz, E., & Porciani, C. 2024, A&A, 690, A72 [NASA ADS] [CrossRef] [EDP Sciences] [Google Scholar]
- Guarcello, M. G., Almendros-Abad, V., Lovell, J. B., et al. 2025, A&A, 693, A120 [NASA ADS] [CrossRef] [EDP Sciences] [Google Scholar]
- Härer, L. K., Reville, B., Hinton, J., Mohrmann, L., & Vieu, T. 2023, A&A, 671, A4 [NASA ADS] [CrossRef] [EDP Sciences] [Google Scholar]
- Härer, L., Vieu, T., & Reville, B. 2025, A&A, 698, A6 [NASA ADS] [CrossRef] [EDP Sciences] [Google Scholar]
- Härer, L., Vieu, T., Schulze, F., Larkin, C. J. K., & Reville, B. 2025, A&A, 703, A111 [NASA ADS] [CrossRef] [EDP Sciences] [Google Scholar]
- Harris, C. R., Millman, K. J., van der Walt, S. J., et al. 2020, Nature, 585, 357 [NASA ADS] [CrossRef] [Google Scholar]
- Haubner, K., Sasaki, M., Mitchell, A., et al. 2025, A&A, 695, A3 [NASA ADS] [CrossRef] [EDP Sciences] [Google Scholar]
- Hawcroft, C., Sana, H., Mahy, L., et al. 2024, A&A, 688, A105 [NASA ADS] [CrossRef] [EDP Sciences] [Google Scholar]
- Hawcroft, C., Leitherer, C., Aranguré, O., et al. 2025, ApJS, 280, 5 [Google Scholar]
- Hunter, J. D. 2007, Comput. Sci. Eng., 9, 90 [NASA ADS] [CrossRef] [Google Scholar]
- Kader, J. A., U, V., Rich, J. A., et al. 2025, ApJ, 988, 230 [Google Scholar]
- Kee, N. D., Sundqvist, J. O., Decin, L., de Koter, A., & Sana, H. 2021, A&A, 646, A180 [NASA ADS] [CrossRef] [EDP Sciences] [Google Scholar]
- Lahén, N., Naab, T., Rantala, A., & Partmann, C. 2025, MNRAS, 543, 1023 [Google Scholar]
- Larkin, C. J. K., Mackey, J., Haworth, T. J., & Sander, A. A. C. 2025, A&A, 700, A60 [NASA ADS] [CrossRef] [EDP Sciences] [Google Scholar]
- Leitherer, C., Schaerer, D., Goldader, J. D., et al. 1999, ApJS, 123, 3 [Google Scholar]
- Leitherer, C., Ekström, S., Meynet, G., et al. 2014, ApJS, 212, 14 [Google Scholar]
- Linden, S. T., Lai, T., Evans, A. S., et al. 2024, ApJ, 974, L27 [Google Scholar]
- Maltsev, K., Schneider, F. R. N., Mandel, I., et al. 2025, A&A, 700, A20 [NASA ADS] [CrossRef] [EDP Sciences] [Google Scholar]
- Merritt, J., Stevenson, S., Sander, A., et al. 2025, ArXiv e-prints [arXiv:2507.17052] [Google Scholar]
- Morlino, G., Blasi, P., Peretti, E., & Cristofari, P. 2021, MNRAS, 504, 6096 [NASA ADS] [CrossRef] [Google Scholar]
- Portegies Zwart, S. F., McMillan, S. L. W., & Gieles, M. 2010, ARA&A, 48, 431 [NASA ADS] [CrossRef] [Google Scholar]
- Povich, M. S., Benjamin, R. A., Whitney, B. A., et al. 2008, ApJ, 689, 242 [NASA ADS] [CrossRef] [Google Scholar]
- Sabhahit, G. N., Vink, J. S., Higgins, E. R., & Sander, A. A. C. 2022, MNRAS, 514, 3736 [NASA ADS] [CrossRef] [Google Scholar]
- Sana, H., de Mink, S. E., de Koter, A., et al. 2012, Science, 337, 444 [Google Scholar]
- Sander, A. A. C., & Vink, J. S. 2020, MNRAS, 499, 873 [Google Scholar]
- Sander, A. A. C., Vink, J. S., & Hamann, W. R. 2020, MNRAS, 491, 4406 [Google Scholar]
- Sander, A. A. C., Lefever, R. R., Poniatowski, L. G., et al. 2023, A&A, 670, A83 [NASA ADS] [CrossRef] [EDP Sciences] [Google Scholar]
- Schneider, F. R. N., Podsiadlowski, P., & Müller, B. 2021, A&A, 645, A5 [NASA ADS] [CrossRef] [EDP Sciences] [Google Scholar]
- Stevens, I. R., & Hartwell, J. M. 2003, MNRAS, 339, 280 [NASA ADS] [CrossRef] [Google Scholar]
- Vieu, T., & Reville, B. 2023, MNRAS, 519, 136 [Google Scholar]
- Vieu, T., Larkin, C. J. K., Härer, L., et al. 2024, MNRAS, 532, 2174 [NASA ADS] [CrossRef] [Google Scholar]
- Vink, J. S., & Sander, A. A. C. 2021, MNRAS, 504, 2051 [NASA ADS] [CrossRef] [Google Scholar]
- Webb, T. L., Rodriguez, J. A., Lopez, L. A., et al. 2024, ApJ, 977, 45 [Google Scholar]
- Yang, M., Bonanos, A. Z., Jiang, B., et al. 2023, A&A, 676, A84 [NASA ADS] [CrossRef] [EDP Sciences] [Google Scholar]
Appendix A: Sensitivity to OB and WR wind prescriptions
A.1. OB winds
In Fig. A.1 we show the effects of using the wind prescriptions of Vink & Sander (2021), Björklund et al. (2021), and Hawcroft et al. (2024) on Lmech, tot and  for ZMW.
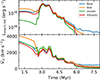 |
Fig. A.1. Time evolution of Lmech, tot (upper panel) and |

For Lmech, tot, the prescriptions introduce variations of 0.1 dex or less, with the exception of the Björklund rates which reduce Lmech, tot by ∼0.8 dex, as discussed in Hawcroft et al. (2025). The variations are only prominent before evolved stars begin to contribute at ∼2.5 Myr.
For  , variations until this time are present but of order 100 km s−1, with the exception of the the Vink & Sander (2021) rates. The increased v∞ in this prescription increases
  by ∼500 km s−1 before evolved stars begin to contribute. In both cases, the changes in OB wind prescriptions are negligible after this time.
A.2. WR winds
In Fig. A.2 we show the effects of using the WR wind prescription of Sander & Vink (2020), including the temperature dependence recommended in Sander et al. (2023), on Lmech, tot and  for ZMW, assuming only WR stars contribute as for Fig. 2.
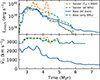 |
Fig. A.2. Time evolution of Lmech (upper panel) and |

We test this prescription for two cases, firstly applying only the Sander & Vink (2020) prescription to all WR stars as defined earlier, and secondly applying the Sander & Vink (2020) prescription with temperature dependence (Sander et al. 2023) to WR stars with Teff > 90 kK, which is the regime they were derived for, and using the Base prescription for cooler WR stars. We use the default v∞ prescriptions in PYSB for all cases.
In the upper panel, there is a moderate change in Lmech of order 0.1−0.2 dex until ∼3 Myr. At this point the hot WR stars become active and Lmech increases by up to an order of magnitude for the temperature-dependent case compared to the Base scenario until ∼4.5 Myr. The effects of the WR prescriptions on  are comparatively small, changing by ∼100 km s−1 at most.
There is a tiny contribution from winds classified as WR in the code for ZIZw18 due to a ‘sweet spot’ of low Z and high Teff. We assess the impact of this by comparing the Base prescription with increasing the WR Teff criterion to log10Teff > 4.44 (i.e. from ∼25 kK to 27.5 kK), thus making the WR assignment negligible. This makes a difference of order a few percent for Lmech, tot and less than 1% for  .
.
All Figures
|
Fig. 1. Time evolution of Lmech, tot (upper panel) and |
| In the text | |
|
Fig. 2. Time evolution of Lmech (upper panel) and |
| In the text | |
|
Fig. 3. Time evolution of the relative contribution of each stellar class to the total Lmech, tot (upper panel) and Ṁcl (lower panel) for ZMW. |
| In the text | |
|
Fig. 4. Time evolution of |
| In the text | |
|
Fig. A.1. Time evolution of Lmech, tot (upper panel) and |
| In the text | |
|
Fig. A.2. Time evolution of Lmech (upper panel) and |
| In the text | |
Current usage metrics show cumulative count of Article Views (full-text article views including HTML views, PDF and ePub downloads, according to the available data) and Abstracts Views on Vision4Press platform.
Data correspond to usage on the plateform after 2015. The current usage metrics is available 48-96 hours after online publication and is updated daily on week days.
Initial download of the metrics may take a while.