Fig. 2.
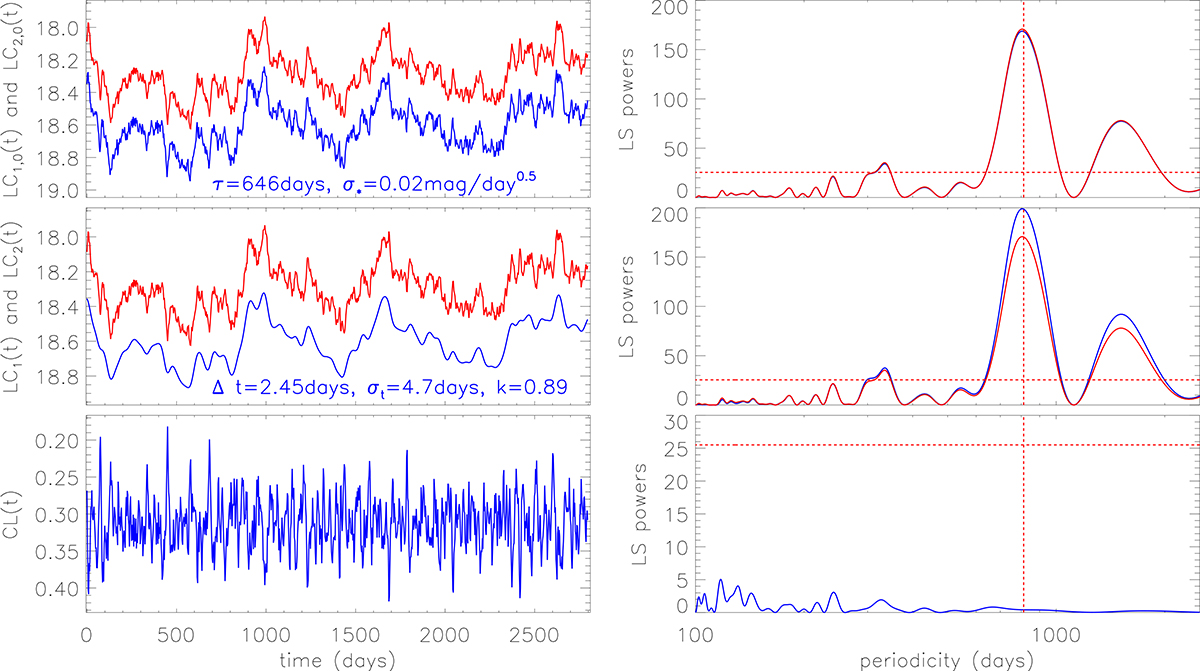
Download original image
Left panels: Light curves of LC1, 0(t) (in blue) and LC2, 0(t) (in red) (top left panel); LC1(t) (in blue) and LC2(t) (in red) (middle left panel); and Color(t) (bottom left panel). Right panels: Corresponding LS powers. In the top right panel (middle right panel), the solid line in blue and red show the results through LC1, 0(t) (LC1(t)) and LC2, 0(t) (LC2(t)), respectively. In each right panel, the horizontal dashed red line marks the 5σ significance level (determined by the input false alarm probability to be 3 × 10⁻⁷); the vertical dashed red line marks the position of periodicity around 812 days determined in LC1(t).
Current usage metrics show cumulative count of Article Views (full-text article views including HTML views, PDF and ePub downloads, according to the available data) and Abstracts Views on Vision4Press platform.
Data correspond to usage on the plateform after 2015. The current usage metrics is available 48-96 hours after online publication and is updated daily on week days.
Initial download of the metrics may take a while.