Open Access
Fig. 3.
Download original image
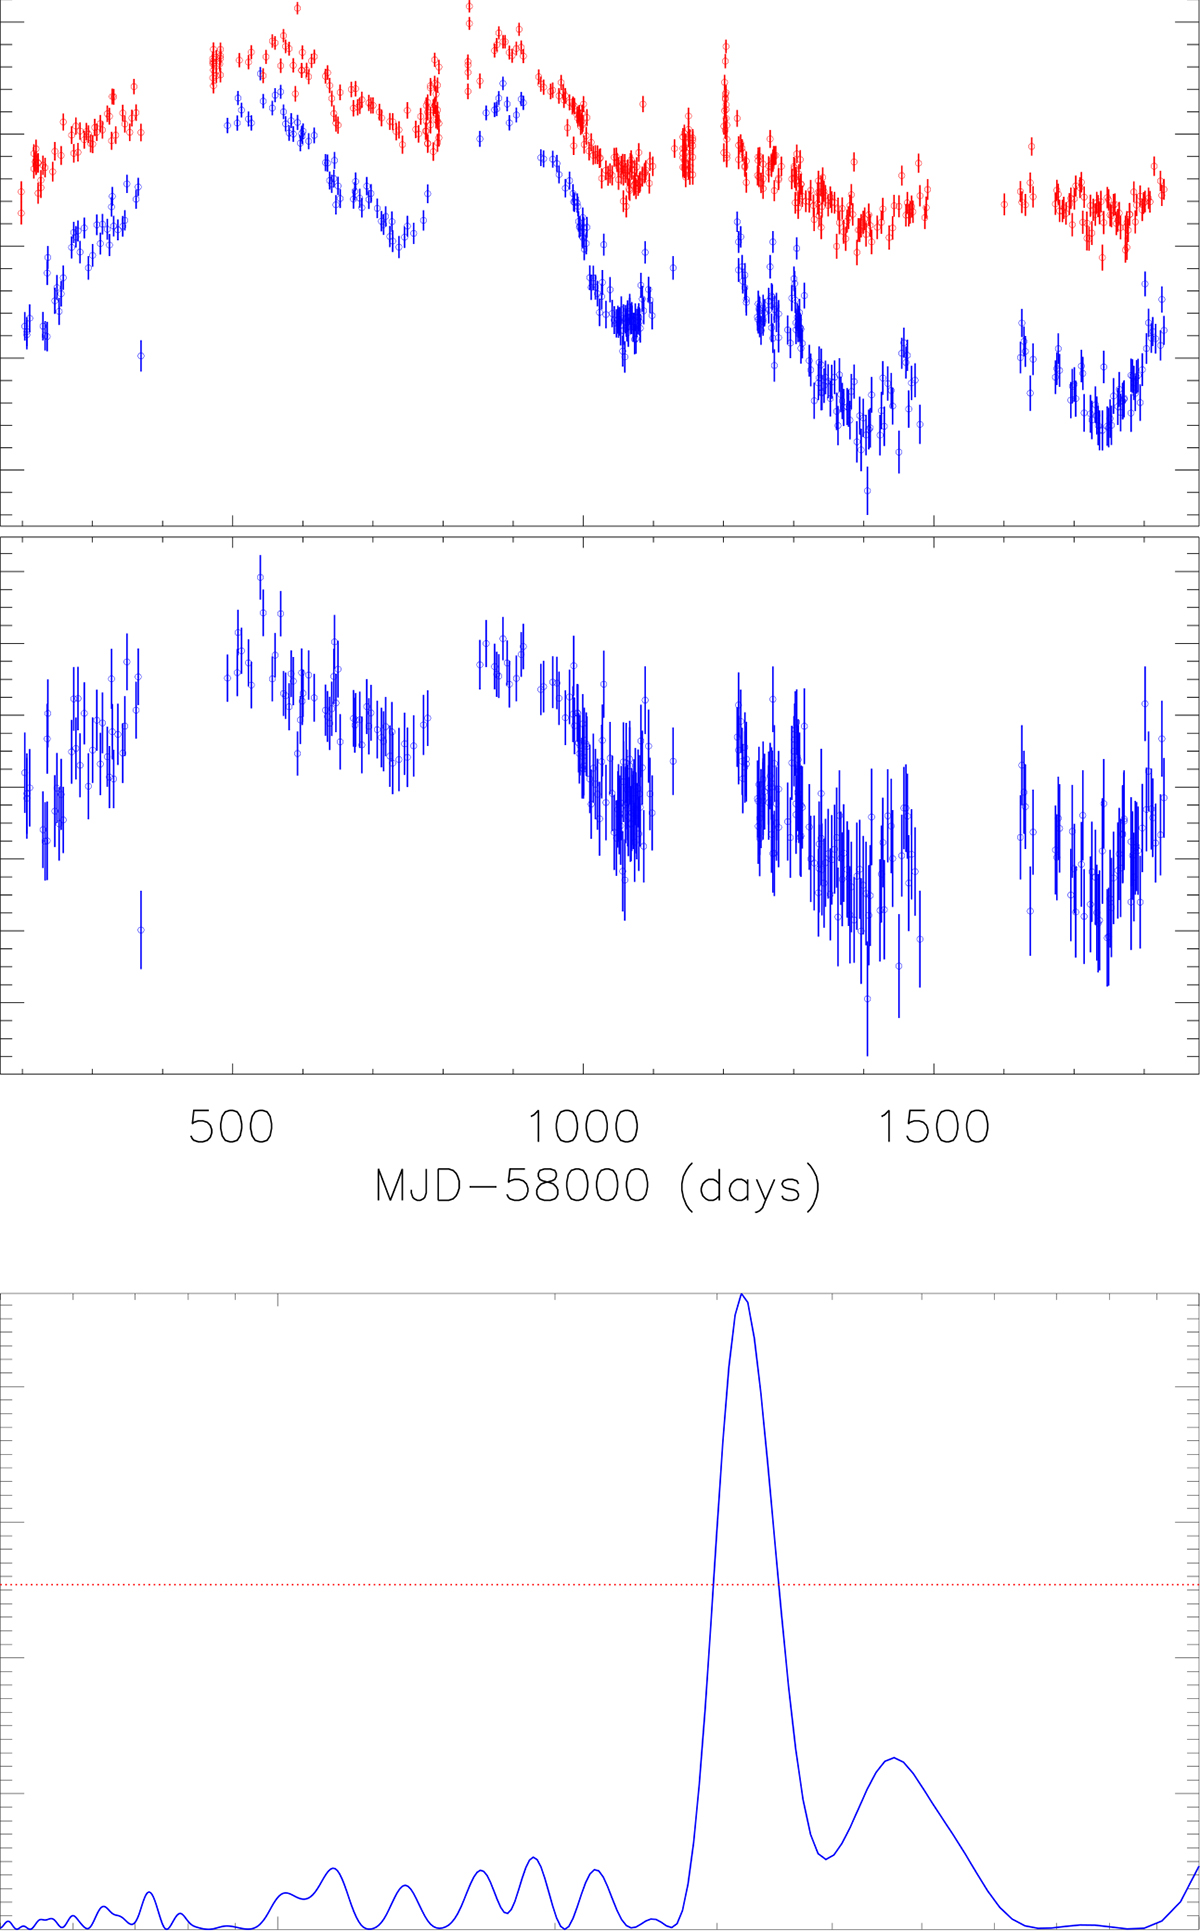
Top panel: ZTF g-band (blue symbols) and r-band (red symbols) light curves of SDSS J1609+1756. Middle panel: CL(t). Bottom panel: Determined LS powers of CL(t). The horizontal dashed red line is the 5σ significance level.
Current usage metrics show cumulative count of Article Views (full-text article views including HTML views, PDF and ePub downloads, according to the available data) and Abstracts Views on Vision4Press platform.
Data correspond to usage on the plateform after 2015. The current usage metrics is available 48-96 hours after online publication and is updated daily on week days.
Initial download of the metrics may take a while.