| Issue |
A&A
Volume 703, November 2025
|
|
|---|---|---|
| Article Number | L3 | |
| Number of page(s) | 8 | |
| Section | Letters to the Editor | |
| DOI | https://doi.org/10.1051/0004-6361/202557182 | |
| Published online | 30 October 2025 | |
Letter to the Editor
Matter power spectrum reconstruction with KiDS-Legacy: Improved internal ΛCDM consistency and preference for strong baryonic feedback
1
Lorentz Institute for Theoretical Physics, Leiden University, PO Box 9506 NL-2300 RA Leiden, The Netherlands
2
Leiden Observatory, Leiden University, PO Box 9513 NL-2300 RA Leiden, The Netherlands
3
Universität Bonn, Argelander-Institut für Astronomie, Auf dem Hügel 71, 53121 Bonn, Germany
4
Ruhr University Bochum, Faculty of Physics and Astronomy, Astronomical Institute (AIRUB), German Centre for Cosmological Lensing, 44780 Bochum, Germany
5
School of Mathematics, Statistics and Physics, Newcastle University, Herschel Building, NE1 7RU Newcastle-upon-Tyne, UK
6
Center for Theoretical Physics, Polish Academy of Sciences, al. Lotników 32/46, 02-668 Warsaw, Poland
7
Institute for Astronomy, University of Edinburgh, Royal Observatory, Blackford Hill, Edinburgh EH9 3HJ, UK
8
Department of Physics and Astronomy, University College London, Gower Street, London WC1E 6BT, UK
9
Zentrum für Astronomie, Universitatät Heidelberg, Philosophenweg 12, D-69120 Heidelberg, Germany
10
Institute for Theoretical Physics, Philosophenweg 16, D-69120 Heidelberg, Germany
11
Dipartimento di Fisica e Astronomia “Augusto Righi” – Alma Mater Studiorum Universitá di Bologna, Via Piero Gobetti 93/2, I-40129 Bologna, Italy
12
Istituto Nazionale di Astrofisica (INAF) – Osservatorio di Astrofisica e Scienza dello Spazio (OAS), Via Piero Gobetti 93/3, I-40129 Bologna, Italy
13
Istituto Nazionale di Fisica Nucleare (INFN) – Sezione di Bologna, Viale Berti Pichat 6/2, I-40127 Bologna, Italy
14
INAF – Osservatorio Astronomico di Padova, Via dell’Osservatorio 5, 35122 Padova, Italy
15
Institute for Computational Cosmology, Ogden Centre for Fundament Physics – West, Department of Physics, Durham University, South Road, Durham DH1 3LE, UK
16
Centre for Extragalactic Astronomy, Ogden Centre for Fundament Physics – West, Department of Physics, Durham University, South Road, Durham DH1 3LE, UK
⋆ Corresponding authors: This email address is being protected from spambots. You need JavaScript enabled to view it.
, This email address is being protected from spambots. You need JavaScript enabled to view it.
Received:
10
September
2025
Accepted:
8
October
2025
Abstract
Direct measurements of the matter power spectrum, Pm(k, z), provide a powerful tool for investigating the observed tensions between models of structure growth, while also testing the internal consistency of cosmological probes. We analysed the cosmic shear data from the final data release of the Kilo-Degree Survey (KiDS), and present a deprojected Pm(k, z), measured in up to three redshift bins. Compared to analyses using previous KiDS releases, we find improved internal consistency in the z ≲ 0.7 regime. At large scales, k ≲ 0.1 h Mpc−1, our power spectrum reconstruction aligns with ΛCDM predictions with a density fluctuation amplitude σ8 = 0.81. Furthermore, at small scales, k = 3–20 h Mpc−1, the average matter power spectrum is suppressed by 30%±10% (stat.) ± 4% (sys.) with 2.8σ significance relative to a dark matter-only model, consistent with expectations of strong baryonic feedback.
Key words: gravitational lensing: weak / cosmology: observations / large-scale structure of Universe
© The Authors 2025
 Open Access article, published by EDP Sciences, under the terms of the Creative Commons Attribution License (https://creativecommons.org/licenses/by/4.0), which permits unrestricted use, distribution, and reproduction in any medium, provided the original work is properly cited.
This article is published in open access under the Subscribe to Open model. This email address is being protected from spambots. You need JavaScript enabled to view it. to support open access publication.
1. Introduction
The growth of cosmic structure is quantified by the matter power spectrum, Pm(k, z), which is probed across different wavenumbers, k, and redshifts, z, by cosmological observables such as cosmic microwave background lensing (CMB; e.g. Lewis & Challinor 2006), galaxy clustering (e.g. Reid et al. 2010), the Lyman-alpha forest (e.g. Rauch 1998), and weak gravitational lensing (WL; e.g. Kilbinger 2015).
To identify the origins of discrepancies in cosmology inference between different surveys and probes operating at different scales or times, the shape and amplitude of Pm(k, z) can be inferred instead of condensing observations by physical model parameters (Amon & Efstathiou 2022). This approach identifies possible suppression signals relative to a power spectrum in a minimalistic ΛCDM scenario that accounts for structure growth by dark matter-only (DMO) models. The isolated suppression signal may then be used to differentiate signatures from sources within known model uncertainties, such as baryonic effects or new physics (e.g. Preston et al. 2024, 2025). In this work we focus on the interpretation of weak lensing data, for which the uncertainty on the shape of Pm(k, z) is substantial. Thus, a functional form is typically assumed for its shape and/or redshift evolution. Proposed models include either perturbative expansions (Ye et al. 2025) or phenomenological models (Seljak 1998; Pen et al. 2003; Perez Sarmiento et al. 2025).
For this paper we combined the approaches of Broxterman & Kuijken (2024) (hereafter BK24), Simon (2012), and Simon et al. (2025) (hereafter SPBK25) by adopting two different functional forms to extract direct measurements of the matter power spectrum from the cosmic shear data. We compare a rigid double power-law model for Pm(k, z) (BK24), with a flexible deprojected regularised model that infers deviations from a best-fitting DMO reference power spectrum (SPBK25). Both methods, applied to the fourth Kilo-Degree Survey data release (Kuijken et al. 2019, hereafter KiDS-1000), show evidence of Pm(k, z) inconsistent with the ΛCDM constraints derived from the same data, specifically in the redshift evolution. SPBK25 discuss errors in the adopted redshift distributions within tomographic bins or the modelling of intrinsic alignment (IA) of sources as possible reasons for this inconsistency. Furthermore, the recent work from Doux & Karwal (2025) reports differences between Stage III lensing surveys and Planck for Pm(k, z) that are in line with those found in BK24 and SPBK25.
The recently published final KiDS data release (KiDS-Legacy; Wright et al. 2024), featuring more area, an improved redshift calibration, one additional higher-redshift tomographic bin, and a new shear catalogue, supersedes KiDS-1000. While the KiDS-1000 results show a mild tension (2σ–3.5σ) with Planck CMB measurements (Hildebrandt et al. 2017; Asgari et al. 2021), pointing towards a lower S8-amplitude of Pm(k, z), this tension is now alleviated in the final cosmic shear analysis (Stölzner et al. 2025; Wright et al. 2025a). This shift in findings motivates us to repeat our previous Pm(k, z) analysis using the new higher-quality data.
This Letter presents the result of these KiDS-Legacy Pm(k, z) reconstructions with the BK24 and SPBK25 approaches. Section 2 summarises the data and describes minor methodological changes relative to the previous works. Section 3 presents the deprojected matter power spectrum and ratios relative to the DMO reference for single or multiple redshift bins and compares the results to predictions from state-of-the-art cosmological hydrodynamical simulations. The main results are summarised in Sect. 4. Throughout, distances and wavenumbers are reported in comoving units for the Hubble constant H0 = 100 h km s−1 Mpc−1.
2. Data and analysis
We analysed the KiDS-Legacy shear two-point correlation functions, ξ±(ij)(θ), between tomographic bins i and j within the angular range θ ∈ [2′,300′]. This analysis incorporated six source redshift distributions,  with
with  , and the theoretical covariance matrix of ξ±(ij)(θ) uncertainties, based on Reischke et al. (2025). The methodologies employed in this paper are detailed in BK24 and SPBK25. Here we only discuss specific changes to the original set-up and the data used. Appendix B provides additional details on the original methods. Compared to KiDS-1000, major improvements include updated angular scale cuts, new tomographic bins including an additional sixth tomographic bin extending to a photo-z regime of 1.14 < zB ≤ 2 with deeper i-band imaging, a larger survey area (1347 deg2, a ∼34% extension), improved redshift distribution calibration methods (Wright et al. 2025b) leveraging a larger calibration sample (five times the number of spectroscopic redshifts), new multiband image simulations for shear calibration (Li et al. 2023), and a new IA model featuring redshift evolution. The combined increase in survey area and the extra tomographic bin leads to a roughly 3.5-fold increase in the probed cosmic volume.
The novel IA model is motivated by the observed dichotomy between red and blue galaxies, and the observed scaling of the IA strength with halo mass (e.g. Fortuna et al. 2025, Navarro-Gironés et al. 2025). Consistent with the KiDS-Legacy cosmological analysis, we therefore updated the IA kernel to
![Mathematical equation: $$ \begin{aligned} W^{(i)}_{\mathrm{I} }(\chi ) = \underbrace{-A_{\mathrm{IA} }\, f_\mathrm{r} ^{(i)}\, \bigg (\frac{\langle M_\mathrm{h} \rangle ^{(i)}}{M_{\mathrm{h,pivot} }}\bigg )^\beta \, \frac{C_1\,\rho _{\mathrm{cr} }\,\Omega _{\mathrm{m} }}{D_+(\chi )}}_{=:F^{(i)}(\chi )} \,n^{(i)}_s(z[\chi ])\, \frac{\mathrm{d}z(\chi )}{\mathrm{d}\chi }\;, \end{aligned} $$](/articles/aa/full_html/2025/11/aa57182-25/aa57182-25-eq3.gif) (1)
(1)
where χ is the comoving distance, z(χ) is the redshift at χ, AIA is the IA amplitude, Ωm is the total matter density relative to the critical density, D+(χ) is the linear growth factor (defined such that D+(0) = 1), C1 ρcr = 0.0134 is a constant, Mh, pivot = 1013.5 h−1 M⊙ is the pivot halo mass, ⟨Mh⟩(i) is the average halo mass in z-bin i, and β is the power-law exponent denoting the evolution with halo mass. Our fractions of red galaxies, fr(i), use the values in Table B.1 of Wright et al. (2025a).
In our IA upgrade, the deprojected regularisation technique now employs F(i)(χ) for bin i, instead of the previous F(χ), rendering the IA amplitude z-dependent. Furthermore, we marginalised the posterior of Pm(k, z) over the distribution of AIA, β, and ⟨Mh⟩(i) from the KiDS-Legacy cosmological analysis (Wright et al. 2025a). This was done after asserting the Gaussian prior in SPBK25 of  for the angular diameter distance in a flat ΛCDM universe. The DMO reference power spectrum,
  , against which deviations
  are measured, was again halofit (Takahashi et al. 2012) with the SPBK25 parameters, except for a higher σ8 = 0.81 to match the increased ξ±(ij)(θ) amplitude in KiDS-Legacy. We also marginalised over uncertainties in the source redshift distributions, for which we used the shear-independent error model from Wright et al. (2025b) for the calibrated
  .
.
For the double power-law approach, we fixed the IA parameters to the best-fitting ΛCDM values. This choice of IA model details does not have a significant impact. Even in the extreme case where we imposed AIA = 0, our results typically vary by less than 5%–10%, mostly at high z.
3. Results and discussion
We applied the regularised deprojection method (SPBK25) to constrain the deviations fδ(k, z) in 20 logarithmic bins within k = 0.01–20 h Mpc−1. We used two settings, either averaging over the full redshift range Z = [0, 2] or over three separate redshift bins with boundaries Z1 = [0, 0.3], Z2 = [0.3, 0.6], and Z3 = [0.6, 2] to probe for redshift evolution. In the BK24 method, we fitted the double power law to the full angular scale and redshift range of the ξ±(ij)(θ) data provided.
3.1. Matter power spectrum constraints
Figure 1 presents the inferred Pm(k, z) as a function of scale for the three redshift bins Z1–Z3. The Bayesian posterior constraints,  , are plotted as solid curves for the median with 68th percentile credible intervals (CIs) at the central values, zc, of their respective redshift bins: zc = 0.15 (purple), 0.45 (blue), and 1.3 (green); the posterior predictive distribution in comparison to the KiDS-Legacy data, and their good match, is shown in Appendix D. As pointed out in SPBK25, most of the lensing signal on the average fδ(k, z) originates from lower redshifts within Z1–Z3, approximately z = 0.13, 0.4, and 0.7, respectively. The dashed curves correspond to the best-fit double power law (with kpiv = 0.5 h Mpc−1 and zpiv = 0.33),
 (2)
(2)
and the additional black curves in the figure correspond to the ΛCDM matter power spectrum obtained with the best-fitting parameters from the KiDS-Legacy cosmic shear inference.
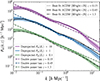 |
Fig. 1. Power spectrum constraints in three variants. The solid coloured lines are regularised deprojections with 68% CIs for three redshift bins Z1 = [0, 0.3], Z2 = [0.3, 0.6], and Z3 = [0.6, 2], and the dashed lines are the best fits of a double power law, Eq. (2), all interpolated to the centres of Z1–Z3. The best-fitting ΛCDM constraints by Wright et al. (2025a) are shown as black curves. For clarity, the curves corresponding to the different redshift bins are scaled by factors of 0.1, 1, or 10. The lensing constraints for Z3 are mostly from structures near z ∼ 0.7 (see text). |
In general, the two reconstruction methods and the ΛCDM fit provide consistent constraints for Pm(k, z), albeit within their limitations. For instance, while the regularised deprojection offers maximum flexibility (0 ≤ fδ ≤ 100 in 20 k-bins), a strict power-law across the entire range k = 0.01–20 h Mpc−1 is not a good fit to ΛCDM lines at the edges of the k-range, specifically for k ≲ 0.03 h Mpc−1 or k ≳ 5 h Mpc−1. However, even the ΛCDM constraint exhibits excessive power in the non-linear regime (k ≳ 3 h Mpc−1) when compared to the posterior CIs of the regularised reconstruction. Regarding redshift evolution, the double power-law indicates a slightly weaker evolution with redshift than the regularised construction. However, the double power law is also ill constrained, as shown in Eq. (2) and, due to deviations from a simple power law, it also depends on the k-range used in the fit. Nevertheless, the detected amplitude change in the power law improves upon the previous inconclusive KiDS-1000 results (BK24), clearly favouring structure growth with time. A similar conclusion can be drawn from the regularised deprojection, being consistent with the ΛCDM model and its change with z for k ≲ 0.1 h Mpc−1.
3.2. Internal consistency with ΛCDM
In Fig. 2, we present the constraints for fδ(k, z) for three redshift bins (Z1: purple, Z2: blue, Z3: green). The bins are individually 68% CI consistent with their DMO reference for k ≲ 0.1 h Mpc−1. At the 1σ level, however, the highest redshift bin, Z3, still favours slightly more power than the reference spectra at intermediate scales, k ∼ 1 h Mpc−1, which might reflect an actual deviation from a DMO scenario on non-linear scales. Our findings are in contrast with the analysis of SPBK25, which identified an internally inconsistent evolution of Pm(k, z) with the best-fitting ΛCDM cosmology. SPBK25 show that for KiDS-1000, the deviations at medium redshift, Z2, and high redshift, Z3, differ significantly from the KiDS-1000 DMO reference, resulting in a Pm(k, z) without significant structure growth in the range z = 0.4–0.7, also at large scales. This inconsistency is no longer present in our analysis with KiDS-Legacy.
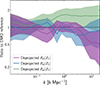 |
Fig. 2. Average ratio of the matter power spectrum to the DMO reference within the three redshift bins Z1–Z3 derived using the method of regularised deprojection. The shaded regions represent the 68% CIs of the posterior constraints for Z1 (purple), Z2 (blue), and Z3 (green). At large scales, k ≲ 0.1 h Mpc−1, all three redshift bins align with the expected DMO redshift evolution. |
We attribute the improvement over KiDS-1000 primarily to the enhanced redshift-estimation methodology and the increase in data samples (Wright et al. 2025b). This aligns with the conclusions of Wright et al. (2025a) and Stölzner et al. (2025), who identify the improved redshift distribution estimation as a major contributor to alleviating the S8 tension. Further factors contributing to consistency with the Planck cosmology include the increased survey volume and improved shear calibration. Our analysis also indicates that the refined IA model has a minor beneficial impact on the robustness for the deprojected Pm(k, z): it shifts the CI in Fig. 2 closer to fδ(k, z) = 1 by 5%–10% relative to results without IA treatment (not shown). The potential for systematic errors in fδ(k, z) stemming from redshift calibration errors and z-dependent IA are further discussed in SPBK25, but these errors contribute less than 10% to the total statistical error.
3.3. Small-scale suppression
To boost the signal-to-noise ratio, the 20 grey violin data points in Fig. 3 average the constraints for fδ(k, z) for a single broad redshift bin, Z = Z1 ∪ Z2 ∪ Z3. The width of the contours represents the posterior probability density. The dark grey horizontal lines show the median; the 68% and 95% CIs are indicated by open boxes and vertical black sticks. At the 1σ level, fδ(k, z) is constrained to approximately 20% for each k-bin. The broader CIs indicate that uncertainties increase towards the highest and smallest wavenumbers, where cosmic shear is less constraining. At small scales, k ≳ 3 h Mpc−1, there is a clear suppression of the signal. This is better constrained by averaging all data points in the range k = 3–20 h Mpc−1. This average, which accounts for the error correlations of r ≲ 0.3 that increase for  (Appendix C), yields
  . This indicates a 3σ significant detection of suppression of Pm(k, z) relative to
  . We verified this by randomly drawing
  values from a null model, fδ(k, z)≡1, with errors as in our data; 0.3% of these values have
  , compatible with a 3σ detection. A similar fit to the results within the individual bins Z1–Z3 gives
  , 0.71 ± 0.23, and 1.51 ± 0.57 (|r|≤0.4), respectively. The increasing suppression with time is qualitatively consistent with cosmological hydrodynamical simulations (e.g. Schaller et al. 2025) and tentatively suggests suppression only in Z1 and Z2 (z ≲ 0.4), with no suppression in Z3 (z ∼ 0.7) at the 1σ level. In addition to statistical uncertainties, we anticipate a conservative systematic uncertainty of ∼5% for
  because the halofit DMO reference deviates by a factor of 0.95 to 1.05 from the more accurate hmcode2020 (Mead et al. 2021) in the regime of k = 2–10 h Mpc−1. Consequently, using hmcode2020 as the DMO reference changes
  by a similar factor.
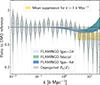 |
Fig. 3. Violin plot of the matter power spectrum relative to the DMO spectrum in 20 bands, similar to Fig. 2, but for a single broad redshift bin, Z, which combines the smaller bins Z1–Z3. The width of the shaded regions represents the posterior probability density; the 68th and 95th percentile CIs about the median are also shown inside the regions (open boxes and sticks, respectively). The green, light blue, and dark blue bands illustrate the suppression predicted by the FLAMINGO cosmological hydrodynamical simulation between z = 0 and 1.5 for the fiducial, weak, and strong feedback models, respectively. The yellow band indicates the mean suppression at small angular scales (68% CI), including correlations between the different points (Fig. C.1), favouring the strong feedback model. |
For theoretical reference, the baryonic suppression signal from the FLAMINGO cosmological hydrodynamical simulations is overplotted in Fig. 3 as shaded coloured areas (Schaye et al. 2023; Kugel et al. 2023; Schaller et al. 2025). These simulations are calibrated to (shifts in) the gas fractions of low-redshift groups and clusters. The green band in Fig. 3 corresponds to the fiducial FLAMINGO suppression between z = 0–1.5. The light and dark blue bands represent variations calibrated to higher (fgas + 2σ) and lower (fgas − 8σ) gas fractions, respectively, which cover the range of predicitions by nearly all modern cosmological simulations (see e.g. Fig. 11 in Schaller et al. 2025). The KiDS-Legacy suppression and the FLAMINGO predictions manifest in the same wavenumber regime, indicating that the signal is consistent with the expectation of baryonic feedback. This represents the most significant direct detection of baryonic feedback from cosmic shear alone (for previous measurements, see Yoon & Jee 2021 and Chen et al. 2023). Therefore, despite the deprojection and systematic uncertainty,  , there is a preference for the stronger feedback model in KiDS-Legacy. Individually, the weak, fiducial, and strong feedback FLAMINGO variations are respectively 2.6σ, 2.3σ, and 1.9σ discrepant from our inferred value of
  . A stronger suppression resonates with recent studies that combine kinetic Sunyaev-Zeldovich (SZ) with either WL (Bigwood et al. 2024), clustering of photometric galaxies (Hadzhiyska et al. 2025), galaxy-galaxy lensing (McCarthy et al. 2025), or X-ray (Kovač et al. 2025), and with analyses using thermal SZ and WL (Tröster et al. 2022; Pandey et al. 2025) or fast radio bursts (Reischke & Hagstotz 2025).
Compared to our regularised deprojection, the KiDS-Legacy results by Wright et al. (2025a) favour weaker feedback, at the level of fgas + 2σ or less (68% CI), for k ≲ 3 h Mpc−1 (their figures 15 and F.3). This discrepancy is also visible in Fig. 1, where the KiDS-Legacy results (black lines using hmcode2020) favour greater power for k ≳ 1 h Mpc−1 than our deprojected Pm(k, z), especially for Z1 when extrapolated to 10 h Mpc−1. We attribute this difference primarily to the employed statistics and their sensitivity to different scales, given the choice of angular cuts. As shown in Wright et al. (2025a, Figure 1), our ξ±(ij)(θ) are sensitive to ℓ ∼ 104, whereas their COSEBIs with orders n ≤ 6 strongly downweight signals beyond ℓ ∼ 103. Therefore, compared to the full physics model and the a priori assumptions in Wright et al. (2025a), our agnostic deprojection is sensitive to physics around k ∼ 5 h Mpc−1, although it is also more susceptible to systematic errors within this non-linear regime. This interpretation of a sensitivity shift aligns with Section 4.3 of Stölzner et al. (2025), who find that bandpowers prefer stronger feedback, peaking near the upper edge of the KiDS-Legacy feedback parameter TAGN prior. The combination of COSEBIs and bandpowers, which have a window function similar to ξ±(ij)(θ), peaks at  . This is, however, dominated by a Bayesian prior that explicitly excludes our suppression level.
4. Conclusions
Compared to KiDS-1000, the cosmic shear data from KiDS-Legacy show an improved degree of internal consistency in the context of ΛCDM. In particular, the deprojected growth of structure in the matter power spectrum is 1σ consistent with that of the ΛCDM inference on large scales (Fig. 2). The change is primarily attributed to an improved source redshift calibration and the revised image reduction.
The data also reveal deviations from a DMO model on small scales, now probed to higher significance due to the ∼3.5 times larger survey volume. We measure growth suppression in the matter power spectrum relative to a DMO model of  at k ≥ 3 h Mpc−1, with tentative evidence that this suppression is restricted to z ≲ 0.4. The average suppression, detected at 2.8σ significance from cosmic shear data alone, is consistent with baryonic feedback predictions in the FLAMINGO simulations and shows a preference for the stronger feedback variation (Fig. 3).
Data availability
Our constraints for the deprojected Pm(k, z) and the correlation matrix of its uncertainties are available at the CDS via https://cdsarc.cds.unistra.fr/viz-bin/cat/J/A+A/703/L3
References
- Amon, A., & Efstathiou, G. 2022, MNRAS, 516, 5355 [CrossRef] [Google Scholar]
- Asgari, M., Lin, C.-A., Joachimi, B., et al. 2021, A&A, 645, A104 [NASA ADS] [CrossRef] [EDP Sciences] [Google Scholar]
- Bigwood, L., Amon, A., Schneider, A., et al. 2024, MNRAS, 534, 655 [NASA ADS] [CrossRef] [Google Scholar]
- Broxterman, J. C., & Kuijken, K. 2024, A&A, 692, A201 [NASA ADS] [CrossRef] [EDP Sciences] [Google Scholar]
- Chen, A., Aricò, G., Huterer, D., et al. 2023, MNRAS, 518, 5340 [Google Scholar]
- Doux, C., & Karwal, T. 2025, ArXiv e-prints [arXiv:2506.16434] [Google Scholar]
- Fortuna, M. C., Dvornik, A., Hoekstra, H., et al. 2025, A&A, 694, A322 [NASA ADS] [CrossRef] [EDP Sciences] [Google Scholar]
- Hadzhiyska, B., Ferraro, S., Ried Guachalla, B., et al. 2025, Phys. Rev. D, 112, 083509 [Google Scholar]
- Hildebrandt, H., Viola, M., Heymans, C., et al. 2017, MNRAS, 465, 1454 [Google Scholar]
- Kilbinger, M. 2015, Rep. Prog. Phys., 78, 086901 [Google Scholar]
- Kovač, M., Nicola, A., Bucko, J., et al. 2025, ArXiv e-prints [arXiv:2507.07991] [Google Scholar]
- Kugel, R., Schaye, J., Schaller, M., et al. 2023, MNRAS, 526, 6103 [NASA ADS] [CrossRef] [Google Scholar]
- Kuijken, K., Heymans, C., Dvornik, A., et al. 2019, A&A, 625, A2 [NASA ADS] [CrossRef] [EDP Sciences] [Google Scholar]
- Lewis, A., & Challinor, A. 2006, Phys. Rep., 429, 1 [Google Scholar]
- Li, S.-S., Kuijken, K., Hoekstra, H., et al. 2023, A&A, 670, A100 [NASA ADS] [CrossRef] [EDP Sciences] [Google Scholar]
- McCarthy, I. G., Amon, A., Schaye, J., et al. 2025, MNRAS, 540, 143 [Google Scholar]
- Mead, A. J., Brieden, S., Tröster, T., & Heymans, C. 2021, MNRAS, 502, 1401 [Google Scholar]
- Navarro-Gironés, D., Gaztañaga, M. C. E., Wittje, A., et al. 2025, MNRAS, in press [arXiv:2505.15470] [Google Scholar]
- Pandey, S., Hill, J. C., Alarcon, A., et al. 2025, ArXiv e-prints [arXiv:2506.07432] [Google Scholar]
- Pen, U.-L., Lu, T., van Waerbeke, L., & Mellier, Y. 2003, MNRAS, 346, 994 [Google Scholar]
- Perez Sarmiento, K., Laguë, A., Madhavacheril, M. S., Jain, B., & Sherwin, B. 2025, Phys. Rev. D, 112, 063510 [Google Scholar]
- Planck Collaboration VI. 2020, A&A, 641, A6 [NASA ADS] [CrossRef] [EDP Sciences] [Google Scholar]
- Preston, C., Amon, A., & Efstathiou, G. 2024, MNRAS, 533, 621 [NASA ADS] [CrossRef] [Google Scholar]
- Preston, C., Rogers, K. K., Amon, A., & Efstathiou, G. 2025, MNRAS, 542, 2698 [Google Scholar]
- Rauch, M. 1998, ARA&A, 36, 267 [Google Scholar]
- Reid, B. A., Percival, W. J., Eisenstein, D. J., et al. 2010, MNRAS, 404, 60 [NASA ADS] [CrossRef] [Google Scholar]
- Reischke, R., & Hagstotz, S. 2025, ArXiv e-prints [arXiv:2507.17742] [Google Scholar]
- Reischke, R., Unruh, S., Asgari, M., et al. 2025, A&A, 699, A124 [NASA ADS] [CrossRef] [EDP Sciences] [Google Scholar]
- Schaller, M., Schaye, J., Kugel, R., Broxterman, J. C., & van Daalen, M. P. 2025, MNRAS, 539, 1337 [Google Scholar]
- Schaye, J., Kugel, R., Schaller, M., et al. 2023, MNRAS, 526, 4978 [NASA ADS] [CrossRef] [Google Scholar]
- Seljak, U. 1998, ApJ, 506, 64 [Google Scholar]
- Simon, P. 2012, A&A, 543, A2 [NASA ADS] [CrossRef] [EDP Sciences] [Google Scholar]
- Simon, P., Porth, L., Burger, P., & Kuijken, K. 2025, A&A, 698, A217 [NASA ADS] [CrossRef] [EDP Sciences] [Google Scholar]
- Stölzner, B., Wright, A. H., Asgari, M., et al. 2025, A&A, 702, A169 [NASA ADS] [CrossRef] [EDP Sciences] [Google Scholar]
- Takahashi, R., Sato, M., Nishimichi, T., Taruya, A., & Oguri, M. 2012, ApJ, 761, 152 [Google Scholar]
- Tröster, T., Mead, A. J., Heymans, C., et al. 2022, A&A, 660, A27 [CrossRef] [EDP Sciences] [Google Scholar]
- Wright, A. H., Kuijken, K., Hildebrandt, H., et al. 2024, A&A, 686, A170 [NASA ADS] [CrossRef] [EDP Sciences] [Google Scholar]
- Wright, A. H., Stölzner, B., Asgari, M., et al. 2025a, A&A, in press, https://doi.org/10.1051/0004-6361/202554908 [Google Scholar]
- Wright, A. H., Hildebrandt, H., van den Busch, J. L., et al. 2025b, A&A, in press, https://doi.org/10.1051/0004-6361/202554909 [Google Scholar]
- Ye, G., Jiang, J.-Q., & Silvestri, A. 2025, JCAP, 2025, 072 [Google Scholar]
- Yoon, M., & Jee, M. J. 2021, ApJ, 908, 13 [NASA ADS] [CrossRef] [Google Scholar]
Appendix A: Acknowledgements
LP acknowledges support from the DLR grant 50QE2302. HHi is supported by a DFG Heisenberg grant (Hi 1495/5-1), the DFG Collaborative Research Center SFB1491, an European Research Council (ERC) Consolidator Grant (No. 770935), and the DLR project 50QE2305. MA acknowledges support from the UK Science and Technology Facilities Council (STFC) under grant number ST/Y002652/1 and the Royal Society under grant numbers RGSR2222268 and ICAR1231094. MB is supported by the Polish National Science Center through grants no. 2020/38/E/ST9/00395 and 2020/39/B/ST9/03494. CH acknowledges support from the Max Planck Society and the Alexander von Humboldt Foundation in the framework of the Max Planck-Humboldt Research Award endowed by the Federal Ministry of Education and Research, and the UK STFC under grant ST/V000594/1. HHo acknowledges support from the ERC under the European Union’s Horizon 2020 research and innovation program with Grant agreement No. 101053992. BJ acknowledges support by the ERC-selected UKRI Frontier Research Grant EP/Y03015X/1 and by STFC Consolidated Grant ST/V000780/1. SSL is receiving funding from the programme “Netzwerke 2021”, an initiative of the Ministry of Culture and Science of the State of Northrhine Westphalia. SSL acknowledges support from the European Research Council (ERC) under the European Union’s Horizon 2020 research and innovation program with Grant agreement No. 101053992. LM acknowledges the financial contribution from the grant PRIN-MUR 2022 20227RNLY3 “The concordance cosmological model: stress-tests with galaxy clusters” supported by Next Generation EU and from the grant ASI n. 2024-10-HH.0 “Attivitá scientifiche per la missione Euclid – fase E”. RR is supported by an ERC Consolidator Grant (No. 770935). MvWK acknowledges the support by UK STFC (grant no. ST/X001075/1), the UK Space Agency (grant no. ST/X001997/1), and InnovateUK (grant no. TS/Y014693/1). Based on data obtained from the ESO Science Archive Facility with DOI: https://doi.org/10.18727/archive/37, and https://doi.eso.org/10.18727/archive/59 and on data products produced by the KiDS consortium. The KiDS production team acknowledges support from: Deutsche Forschungsgemeinschaft, ERC, NOVA and NWO-M grants; Target; the University of Padova, and the University Federico II (Naples). This work used the DiRAC@Durham facility managed by the Institute for Computational Cosmology on behalf of the STFC DiRAC HPC Facility (www.dirac.ac.uk). The equipment was funded by BEIS capital funding via STFC capital grants ST/K00042X/1, ST/P002293/1, ST/R002371/1, and ST/S002502/1, Durham University and STFC operations grant ST/R000832/1. DiRAC is part of the National e-Infrastructure.
Appendix B: Method details
In this Appendix we provide additional information on the method of regularised deprojection in SPBK25 and that of the double power-law fit in BK24.
B.1. Regularised deprojection
For a full account of the regularised reconstruction, we refer to SPBK25, sections 2 and 3. The aim is to have the method invert, without a physical model for the matter power spectrum, the relations
![Mathematical equation: $$ \begin{aligned} \xi _\pm ^{(ij)}(\theta )&=\frac{9H_0^4\Omega _{\rm m}^2}{4c^4}\nonumber \\&\times \int _0^{\chi _{\rm h}} \!\!\!\!\int _0^\infty \frac{\mathrm{d}\chi \,\mathrm{d}\ell \,\ell }{2\pi } \frac{\overline{W}^{(i)}\!(\chi )\overline{W}^{(j)}\!(\chi )}{a^2(\chi )} J_{0,4}(\ell \theta )\, P_{\rm m}\left(\frac{\ell +1/2}{f_{K}(\chi )},z[\chi ]\right) \end{aligned} $$](/articles/aa/full_html/2025/11/aa57182-25/aa57182-25-eq22.gif) (B.1)
(B.1)
with respect to Pm(k, z) for a set of tomographic bins i, j = 1…Ns. Here the lensing efficiency is defined as
![Mathematical equation: $$ \begin{aligned} \overline{W}^{(i)}\!(\chi ):= \int _\chi ^{\chi _{\rm h}}\mathrm{d}\chi ^\prime \; n_{\rm s}^{(i)}(z[\chi ])\,\frac{\mathrm{d}z(\chi )}{\mathrm{d}\chi }\, \frac{f_{K}(\chi ^\prime -\chi )}{f_{K}(\chi ^\prime )}\;, \end{aligned} $$](/articles/aa/full_html/2025/11/aa57182-25/aa57182-25-eq23.gif) (B.2)
(B.2)
which varies with each source distribution  , where c is the vacuum speed of light, H0 is the Hubble parameter, and χh is the horizon of the survey. For brevity, we ignore here two additional IA terms, which, under the adopted IA model, only change the projection kernels inside the Ns integrals (B.1) and do not impact the subsequent statements. The projection kernels depend exclusively on
  , the comoving angular diameter distance fK(χ) (for the curvature scalar K and the comoving distance χ), the matter density Ωm, and the IA parameters. Uncertainties in these four components are propagated into Pm(k, z) by varying the projection kernels in repeated reconstructions.
An exact inversion is infeasible due to a low signal-to-noise ratio, confined angular ranges, and the limited number Ns (Ns + 1)/2 of equations in (B.1). Therefore, as an approximation, we averaged Pm(k, z) within Nz = 1 or 3 broad z-bins in radial direction, spanning z = 0–2, and within Nk = 20 k-bands, ranging between 0.01–20 h Mpc−1. This configuration probes either the full radial average, Nz = 1, or the evolution within Nz = 3 bins. Outside these k and z ranges, the power spectrum is fixed to a reference power spectrum,  , best fit to the data (σ8 = 0.81). All contributions from outside these ranges are encapsulated in the modelled shear signal
  , which constitutes only a small fraction of the expected total signal ξ±(ij)(θ). Within these ranges, the amplitudes in the bands can vary freely between a factor of 0 to 100 of
  .
.
However, broad z-bins complicate the interpretation of the averaged power spectrum due to its variation with z. We untangled this by expressing  relative to the growing
  , and then averaged the more slowly evolving deviations, fδ(k, z), instead. Since the adopted DMO reference accounts for dark matter only, fδ(k, z) also conveniently averages the deviations of the true Pm(k, z) from a model without baryon feedback. Mathematically, our statistical model expresses the deviations fδ(k, z) across Nz × Nk bands as the vector fδ. With the linear projections (B.1) presented by the projection matrix X, the predicted θ-binned ξ±(ij)(θ) is given by
  (assuming fixed projection kernels).
The inversion of the noisy  without further constraints leads to strongly oscillating noise for fδ due to the broad projection kernels and the Bessel functions of first kind, Jn(x), inside the kernels. This issue is mitigated by asserting positive solutions, fδ(k, z)≥0, and by employing a Tikhonov filter (as in SPBK25). This filter attenuates solutions of the band-power fδ that exhibit strong oscillations in the k-direction, effectively reconstructing a k-smoothed solution. Conversely, oscillations in z-direction for Nz > 1 are not filtered to prevent z-smoothing. SPBK25 uses simulated KiDS data for filter settings that strike a balance between degradation by noise and artificial smoothing by the filter.
We inferred the band-power fδ statistically within a Bayesian framework using the posterior probability density function (PDF)  . Here, the prior PDFs
  and
and  implement a uniform prior density, asserting fδ = 0–100, and the Tikhonov regularisation of fδ. The likelihood function,
  , adopts a multivariate Gaussian model for statistical noise in ξ with covariance matrix C. This covariance incorporates contributions from intrinsic shape noise, cosmic variance, super-sample covariance, and the uncertainty in the multiplicative shear bias. We numerically sampled P(fδ|ξ) using a rapidly converging Hamiltonian Monte Carlo algorithm. To propagate statistical errors in
  , the angular diameter distance and Ωm, and IA correlations, we combined different Monte Carlo chains where the projection kernels are randomly drawn from a model of kernel uncertainties. The inferred
  at the centres,
  , of three redshift bins for the averaged
  is shown in Fig. 1 with statistical uncertainties.
B.2. Double power law
For the shape of the matter power spectrum, the analysis of BK24 assumes a double power law of the form
 (B.3)
(B.3)
where the pivot points kpiv and apiv are determined by minimising the covariance between the different model parameters. The free parameters log10(A/h−3 Mpc3), p, and m are inferred through a Bayesian inference by assuming the flat priors log10(A/h−3 Mpc3) ∈ [0, 10],p ∈ [ − 2, 0.5], and m ∈ [ − 5, 5].
Additional freedom in modelling is chosen to replicate the choices made in the Stage III cosmic shear inferences. As such, the free parameters of the IA model, except for AIA, the integration limits of the different two-point statistics, and the scale cuts are taken from the fiducial Stage III cosmic shear inferences. The background cosmology, used to compute the linear growth factor and redshift-comoving distance relation, however, is chosen to be the best-fitting ΛCDM cosmology from Planck Collaboration VI (2020). Changing this to the best-fitting KiDS-1000 cosmology from Asgari et al. (2021) has a negligible impact on the results.
As shown in Fig. 1, the maximum-likelihood solutions (dashed lines) are a reasonable fit to the regularised reconstruction within 0.03 ≲ k ≲ 5 h Mpc−1. The systematically lower amplitude of the fit in this k-regime, compared to the regularised construction, is explained by increasing deviations from self-similar evolution outside this regime.
Appendix C: Correlation matrix of deprojection uncertainties for a single redshift bin
The deprojection of the tomographic ξ±(ij)(θ) into fδ(k, z), with measurement noise localised in θ, produces correlated uncertainties across all k and z bins in fδ(k, z) and, consequently, in Pm(k, z) (SPBK25). Figure C.1 displays the correlation matrix for the results in Fig. 3 with single z-bin Z. The Pearson correlation coefficients, r, of the deprojected Pm(k, z) between 20 logarithmically spaced bins for k = 0.01–20 h Mpc−1 are presented (from bottom left to top right). The blue colours indicate that estimates at different scales are at most moderately correlated, typically with |r|≲0.3. The smallest and largest scales exhibit the strongest correlation with their directly adjacent bins. The correlation matrix for the deprojection with three separate z-bins (Z1 to Z3) is similar to that presented in figure 5 of SPBK25.
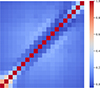 |
Fig. C.1. Matrix of Pearson correlation coefficients for the deprojection with a single z-bin, Z, for 20 logarithmic k-bins in the range k = 0.01 − 20 h Mpc−1. The scale k increases from bottom left to top right. |
Appendix D: Posterior predictive distribution
Figure D.1 is the posterior predictive distribution (PPD) of Pm(k, z) deprojected into three separate redshift bins Z1–Z3 (solid coloured curves in Fig. 1). The 68% and 95% CIs of the PPD (in blue) assume a fixed lensing kernel and no IA uncertainties, which, if accounted for, modestly increase the CIs by approximately 5%. The solid red line represents the prediction from the DMO reference  , adjusted in the Bayesian deprojection by a factor fδ(k, z), presented in Fig. 2, to match the observed data (correlated black data points with 1σ uncertainty). Although an additional sixth source redshift bin is included, compared to the previous KiDS-1000 analysis in SPBK25, our PPD consistently provides a good description of all ξ±(ij)(θ) data points, although a few notable outliers are present, such as for ξ±(33)(θ), ξ+(13)(θ), ξ−(12)(θ), or ξ+(26)(θ).
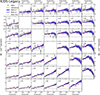 |
Fig. D.1. Posterior predictive distribution (68% and 95% CIs as blue regions) of the deprojected Pm(k, z) in Fig. 1 relative to the black data points – θ ξ−(ij)(θ) in the lower left panels and θ ξ+(ij)(θ) in the upper right panels – for a combination (ij) of tomographic source bins, denoted as ‘z − ij’ inside the panels. The red lines represent the reference model, |

All Figures
|
Fig. 1. Power spectrum constraints in three variants. The solid coloured lines are regularised deprojections with 68% CIs for three redshift bins Z1 = [0, 0.3], Z2 = [0.3, 0.6], and Z3 = [0.6, 2], and the dashed lines are the best fits of a double power law, Eq. (2), all interpolated to the centres of Z1–Z3. The best-fitting ΛCDM constraints by Wright et al. (2025a) are shown as black curves. For clarity, the curves corresponding to the different redshift bins are scaled by factors of 0.1, 1, or 10. The lensing constraints for Z3 are mostly from structures near z ∼ 0.7 (see text). |
| In the text | |
|
Fig. 2. Average ratio of the matter power spectrum to the DMO reference within the three redshift bins Z1–Z3 derived using the method of regularised deprojection. The shaded regions represent the 68% CIs of the posterior constraints for Z1 (purple), Z2 (blue), and Z3 (green). At large scales, k ≲ 0.1 h Mpc−1, all three redshift bins align with the expected DMO redshift evolution. |
| In the text | |
|
Fig. 3. Violin plot of the matter power spectrum relative to the DMO spectrum in 20 bands, similar to Fig. 2, but for a single broad redshift bin, Z, which combines the smaller bins Z1–Z3. The width of the shaded regions represents the posterior probability density; the 68th and 95th percentile CIs about the median are also shown inside the regions (open boxes and sticks, respectively). The green, light blue, and dark blue bands illustrate the suppression predicted by the FLAMINGO cosmological hydrodynamical simulation between z = 0 and 1.5 for the fiducial, weak, and strong feedback models, respectively. The yellow band indicates the mean suppression at small angular scales (68% CI), including correlations between the different points (Fig. C.1), favouring the strong feedback model. |
| In the text | |
|
Fig. C.1. Matrix of Pearson correlation coefficients for the deprojection with a single z-bin, Z, for 20 logarithmic k-bins in the range k = 0.01 − 20 h Mpc−1. The scale k increases from bottom left to top right. |
| In the text | |
|
Fig. D.1. Posterior predictive distribution (68% and 95% CIs as blue regions) of the deprojected Pm(k, z) in Fig. 1 relative to the black data points – θ ξ−(ij)(θ) in the lower left panels and θ ξ+(ij)(θ) in the upper right panels – for a combination (ij) of tomographic source bins, denoted as ‘z − ij’ inside the panels. The red lines represent the reference model, |
| In the text | |
Current usage metrics show cumulative count of Article Views (full-text article views including HTML views, PDF and ePub downloads, according to the available data) and Abstracts Views on Vision4Press platform.
Data correspond to usage on the plateform after 2015. The current usage metrics is available 48-96 hours after online publication and is updated daily on week days.
Initial download of the metrics may take a while.