Fig. 1.
Download original image
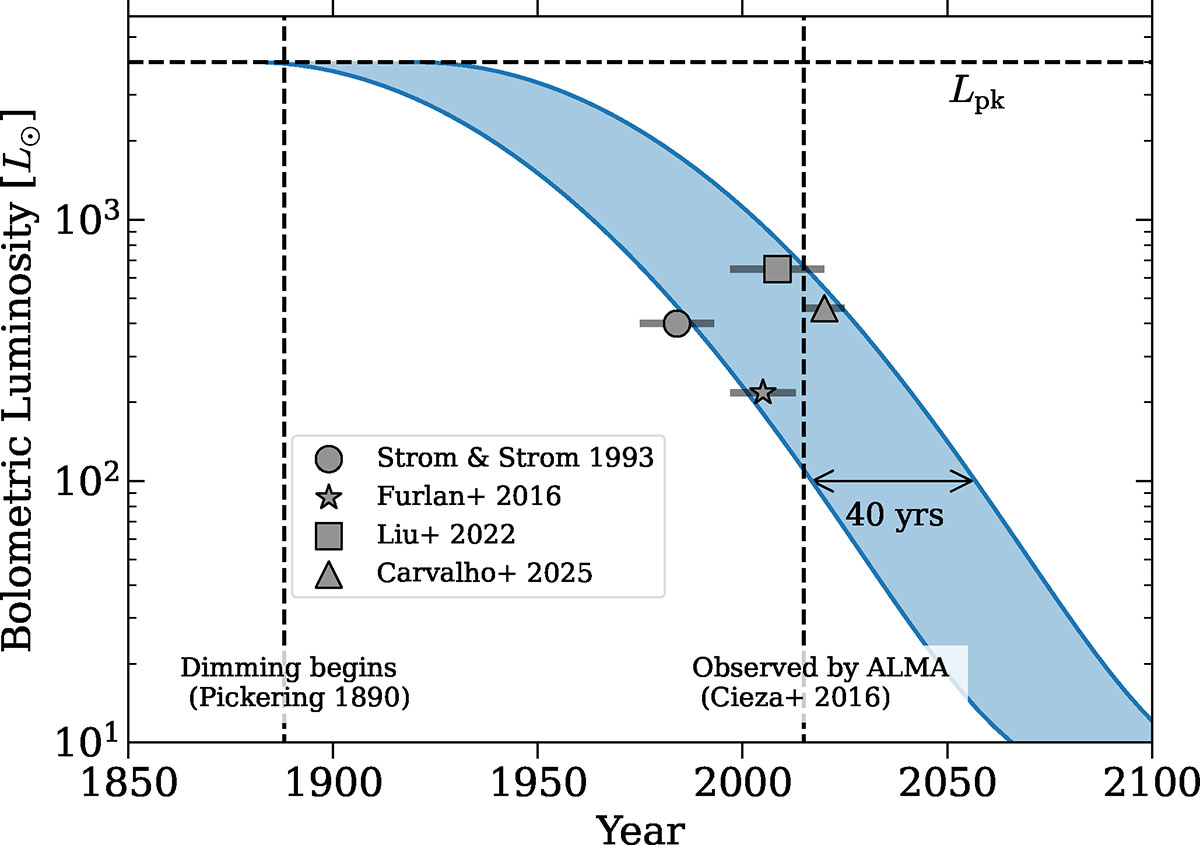
Evolution of the bolometric luminosity of V883 Ori during the outburst dimming phase. The symbols denote measurements from different studies, with horizontal bars showing the time range of adopted data. The blue band represents the adopted luminosity curve, which carries an uncertainty of ∼40 yr due to the uncertainties in estimating Lbol.
Current usage metrics show cumulative count of Article Views (full-text article views including HTML views, PDF and ePub downloads, according to the available data) and Abstracts Views on Vision4Press platform.
Data correspond to usage on the plateform after 2015. The current usage metrics is available 48-96 hours after online publication and is updated daily on week days.
Initial download of the metrics may take a while.