Fig. 3.
Download original image
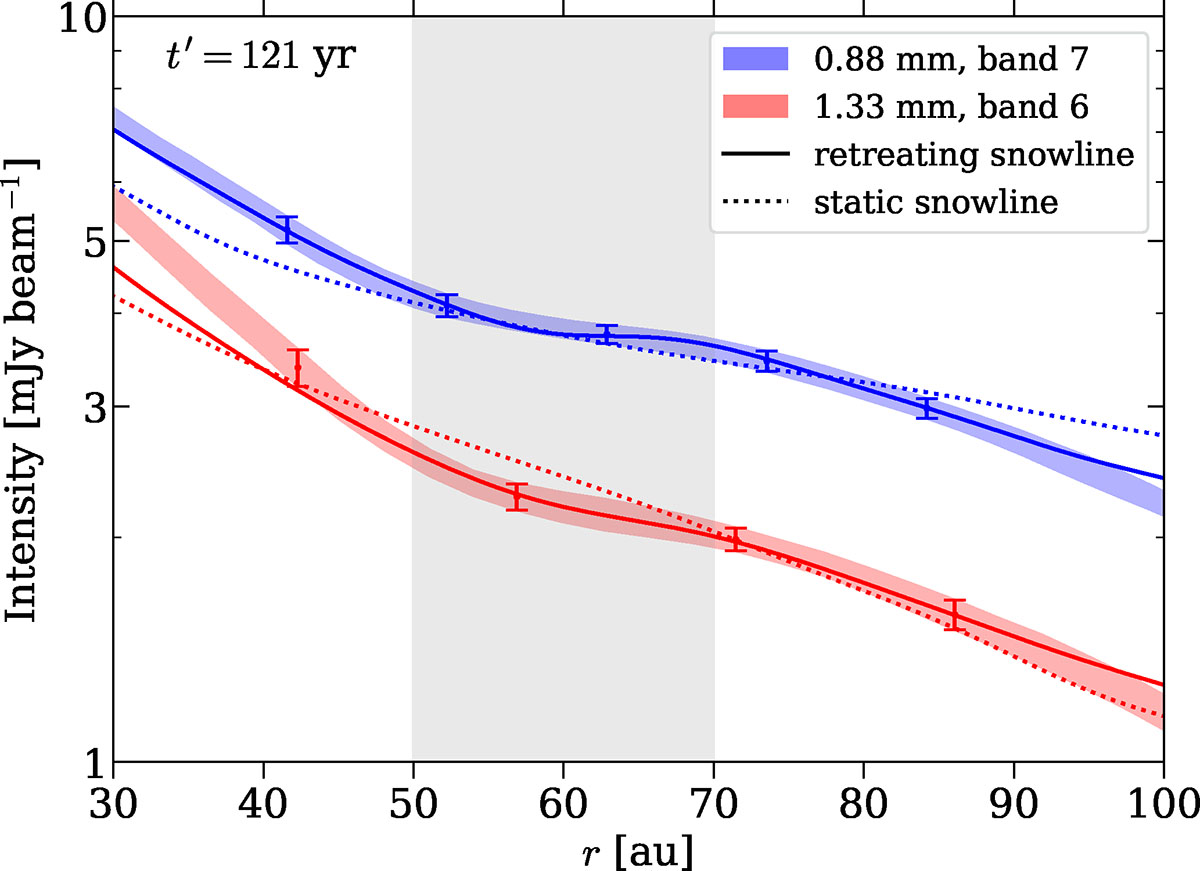
Comparison of the synthetic intensity profiles with ALMA continuum. Crosses show ALMA data adopted from Houge et al. (2024), spaced according to the beam sizes; shaded regions indicate the rms error. Solid lines represent the best-fit retreating snowline model, while dotted lines correspond to the best-fit static model. Enhanced emission toward the inner regions arises likely from intense viscous heating (Alarcón et al. 2024), which is not accounted for in the model.
Current usage metrics show cumulative count of Article Views (full-text article views including HTML views, PDF and ePub downloads, according to the available data) and Abstracts Views on Vision4Press platform.
Data correspond to usage on the plateform after 2015. The current usage metrics is available 48-96 hours after online publication and is updated daily on week days.
Initial download of the metrics may take a while.