Fig. 4.
Download original image
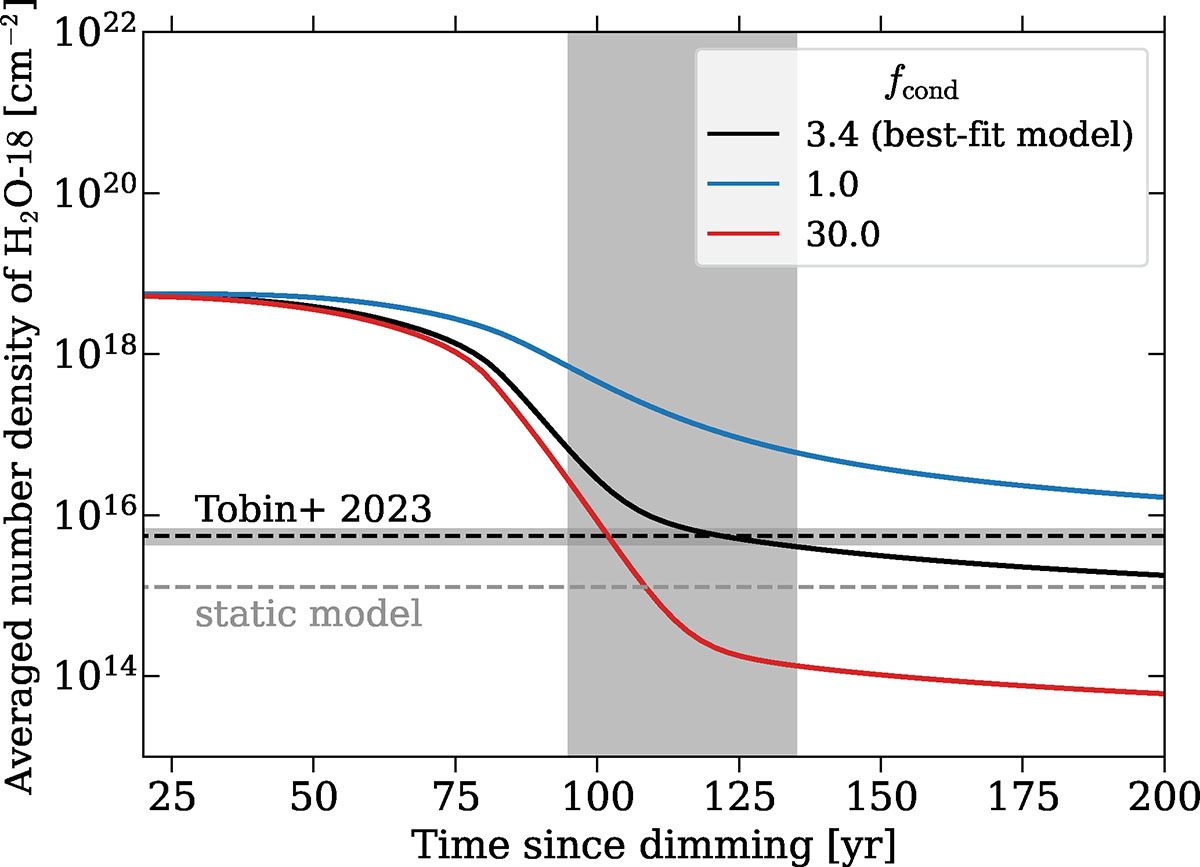
Average column density of H![]() O at 80–120 au under different condensation rates (fcond). The vertical gray band indicates the time range when observing the intensity shoulder. The dashed black line denotes the average column density derived from ALMA band 5 data by Tobin et al. (2023) with 1σ uncertainty shaded in gray. Dotted gray line denotes the best-fit value in static snowline model.
O at 80–120 au under different condensation rates (fcond). The vertical gray band indicates the time range when observing the intensity shoulder. The dashed black line denotes the average column density derived from ALMA band 5 data by Tobin et al. (2023) with 1σ uncertainty shaded in gray. Dotted gray line denotes the best-fit value in static snowline model.
Current usage metrics show cumulative count of Article Views (full-text article views including HTML views, PDF and ePub downloads, according to the available data) and Abstracts Views on Vision4Press platform.
Data correspond to usage on the plateform after 2015. The current usage metrics is available 48-96 hours after online publication and is updated daily on week days.
Initial download of the metrics may take a while.