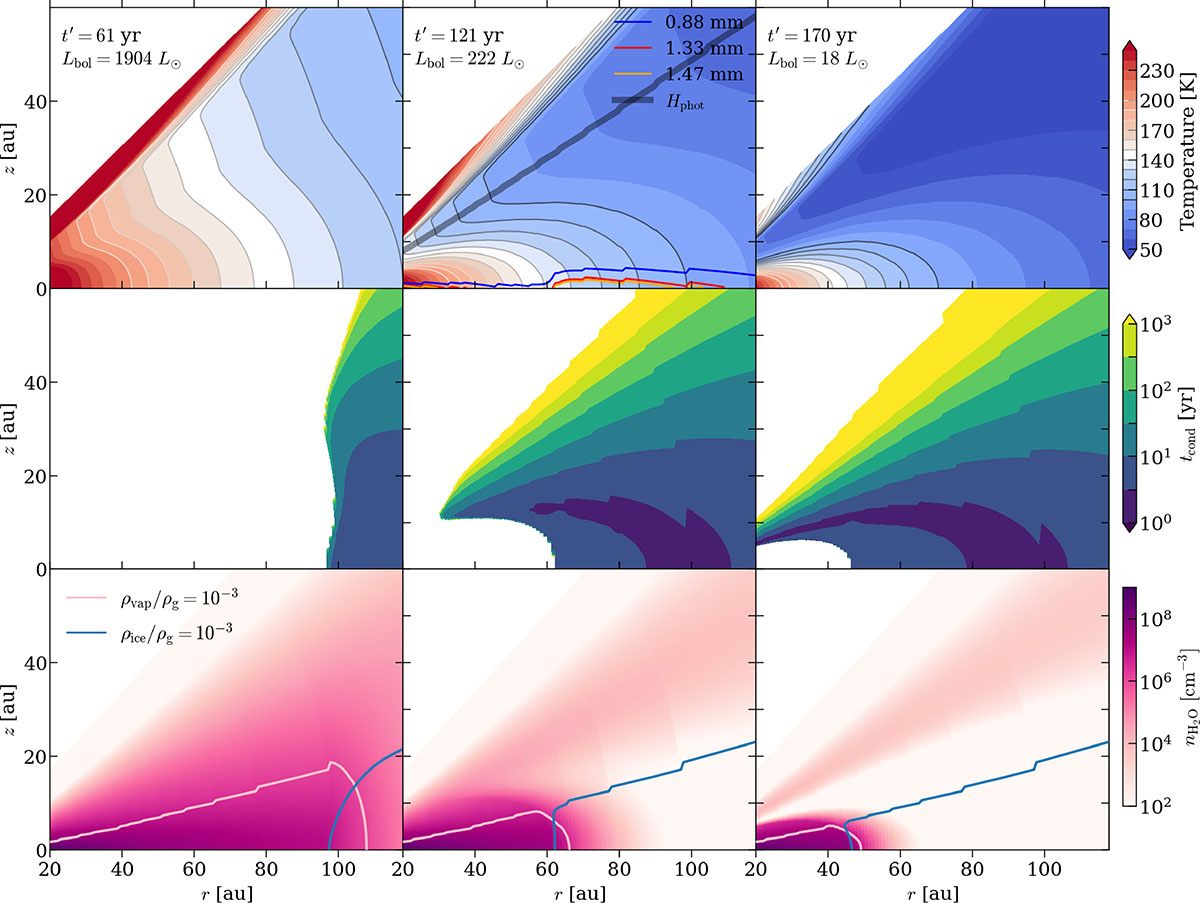
Fig. D.1.
Download original image
Disk temperature, vapor condensation timescale (tcond), and number density of water (nH2O) during the outburst dimming phase of the best-fit model. Here t′=t − tbeg is the time lapse since the bolometric luminosity started to decline. The value of Lbol corresponding to this time is labeled. In the top row, the range of 140-150 K is shaded in white to highlight the snowline region. At t′ = 121 yr – the present epoch – the emission surfaces (τmm = 2/3) of ALMA band 5, 6 and 7 and disk photosphere (see Sect. C) are plotted along with the temperature contour. In the middle row, the region where no condensation occurs is plotted in white. In the bottom row, two lines denoting ice(vapor)-to-gas ratio of 10−3 are indicated to highlight the snowline region.
Current usage metrics show cumulative count of Article Views (full-text article views including HTML views, PDF and ePub downloads, according to the available data) and Abstracts Views on Vision4Press platform.
Data correspond to usage on the plateform after 2015. The current usage metrics is available 48-96 hours after online publication and is updated daily on week days.
Initial download of the metrics may take a while.