Open Access
Fig. 2.
Download original image
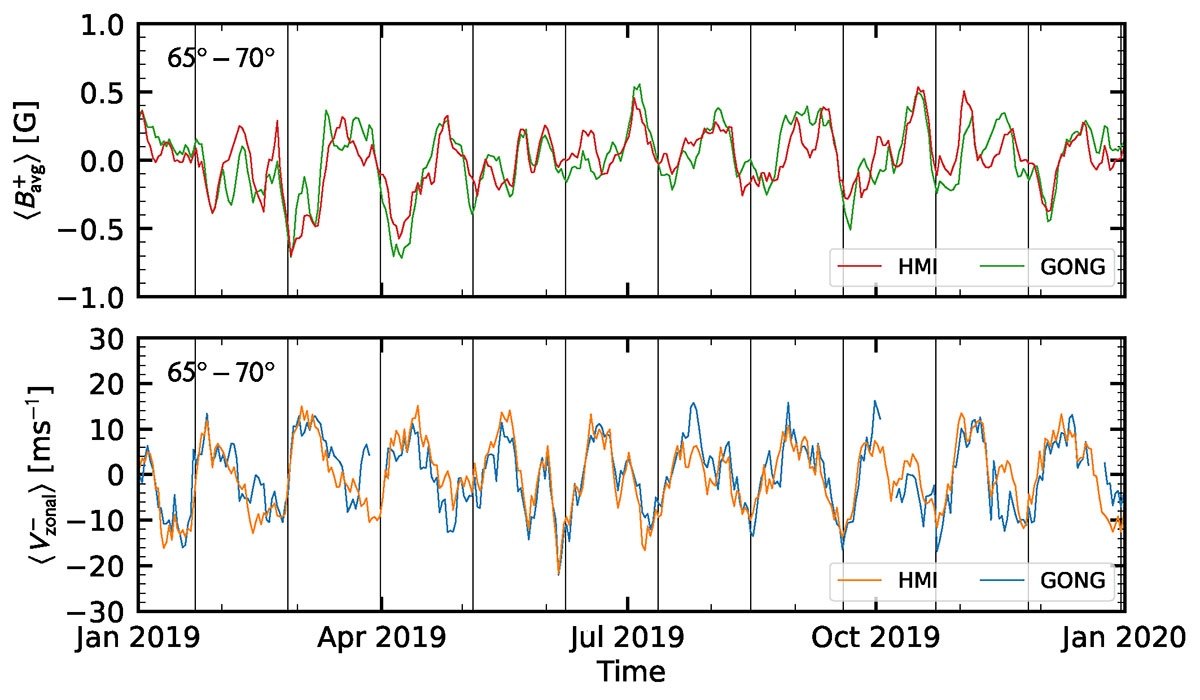
Oscillations of ![]() and
and ![]() in the time series from HMI and GONG data in 2019. A 180-day average was removed, and for clarity, the maps were smoothed with a Gaussian kernel with σ = 1 day. Vertical lines are spaced at intervals of 34 days.
in the time series from HMI and GONG data in 2019. A 180-day average was removed, and for clarity, the maps were smoothed with a Gaussian kernel with σ = 1 day. Vertical lines are spaced at intervals of 34 days.
Current usage metrics show cumulative count of Article Views (full-text article views including HTML views, PDF and ePub downloads, according to the available data) and Abstracts Views on Vision4Press platform.
Data correspond to usage on the plateform after 2015. The current usage metrics is available 48-96 hours after online publication and is updated daily on week days.
Initial download of the metrics may take a while.