Fig. 4.
Download original image
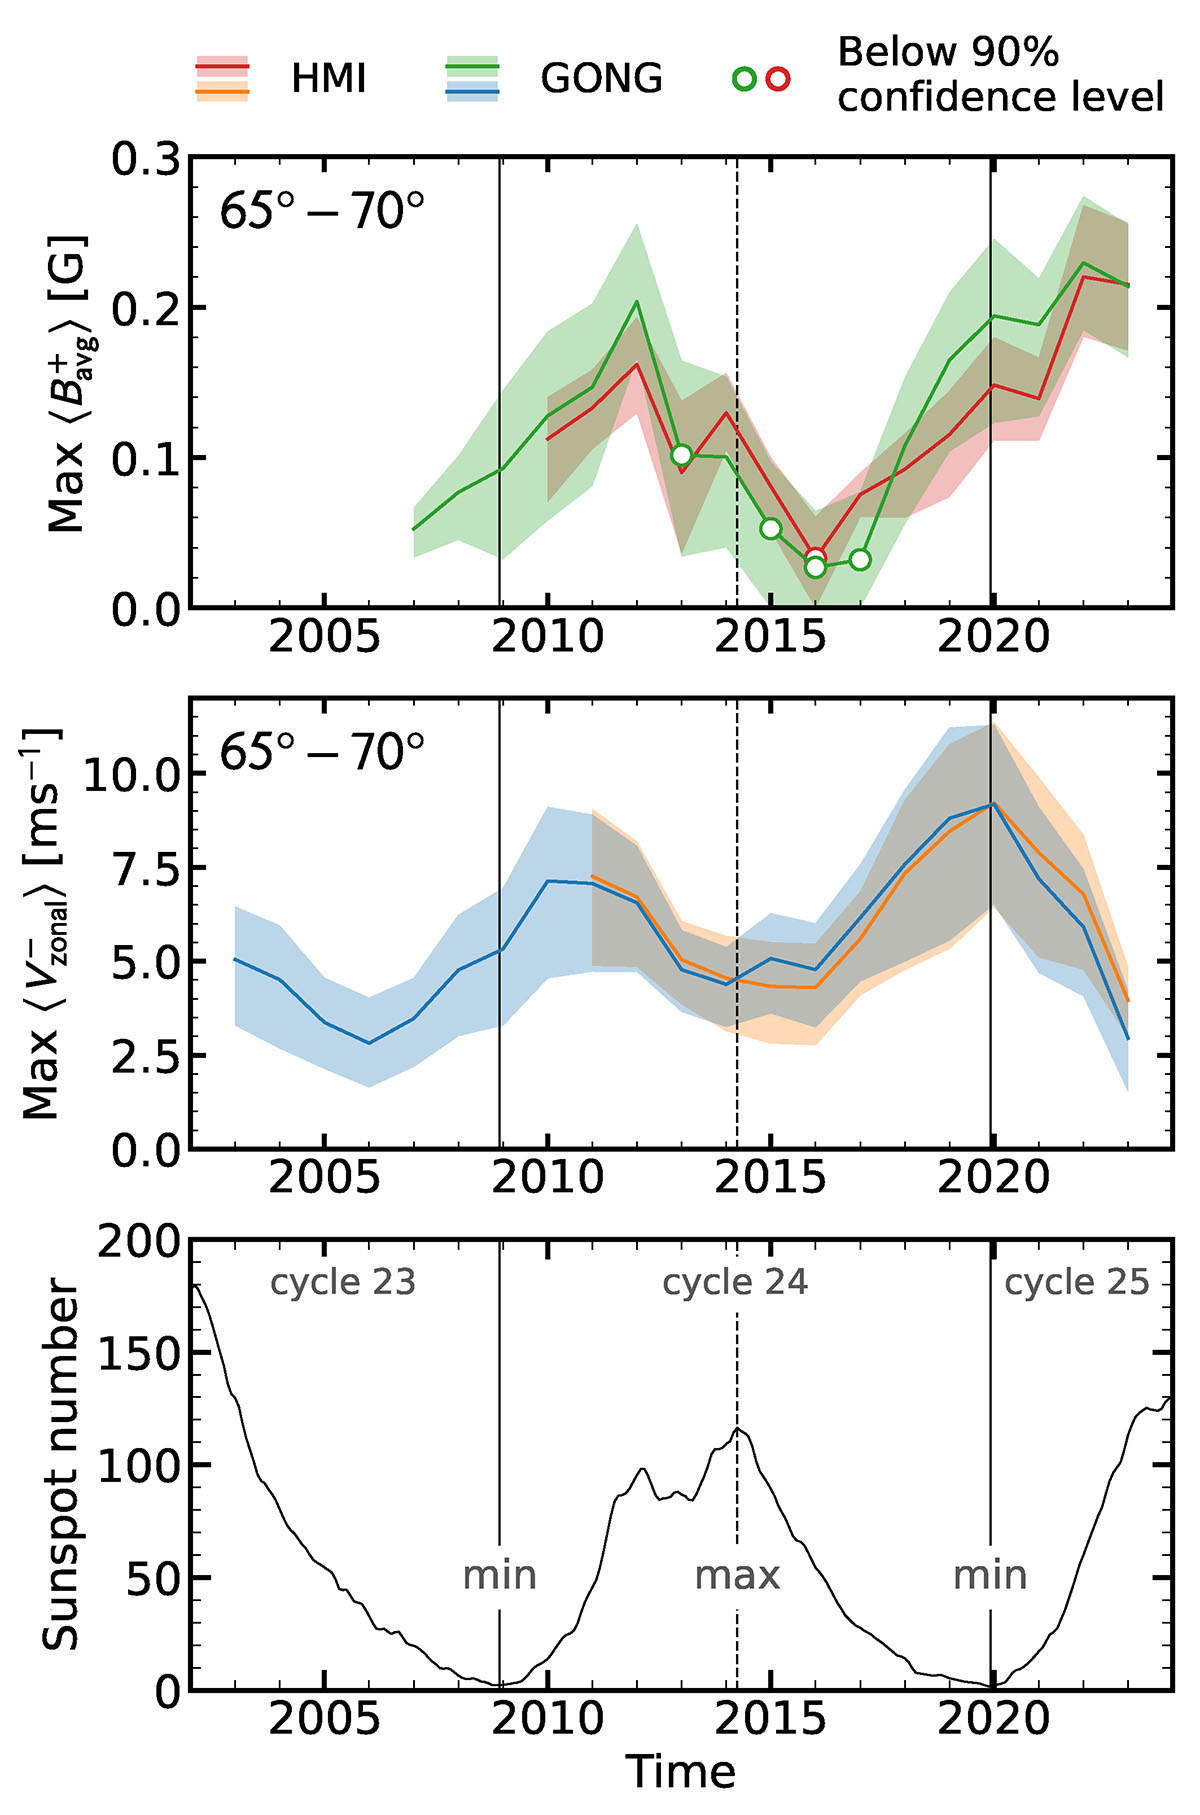
Top and middle panels: Temporal variations of the m = 1 mode amplitude extracted from Blos and Vlos data, respectively. The red, orange, green, and blue curves correspond to results from the HMI ![]() , HMI
, HMI ![]() , GONG
, GONG ![]() , and GONG
, and GONG ![]() datasets, respectively. Shaded regions indicate the 68% confidence interval, estimated using 10 000 Monte Carlo simulations. Open circles denote instances where the excess power near the mode frequency falls below the 90% confidence level. We note that
datasets, respectively. Shaded regions indicate the 68% confidence interval, estimated using 10 000 Monte Carlo simulations. Open circles denote instances where the excess power near the mode frequency falls below the 90% confidence level. We note that ![]() was derived directly from the LOS Doppler velocity (Eqs. (4)–(6)); unlike LG25, we did not apply a multiplicative factor to scale the
was derived directly from the LOS Doppler velocity (Eqs. (4)–(6)); unlike LG25, we did not apply a multiplicative factor to scale the ![]() amplitudes to match the horizontal velocities from the ring-diagram maps. Vertical lines denote key phases of the solar cycle, with solid lines representing solar minima and dashed lines indicating solar maxima. Bottom panel: Average sunspot number (source: WDC-SILSO, Royal Observatory of Belgium, Brussels, https://doi.org/10.24414/qnza-ac80).
amplitudes to match the horizontal velocities from the ring-diagram maps. Vertical lines denote key phases of the solar cycle, with solid lines representing solar minima and dashed lines indicating solar maxima. Bottom panel: Average sunspot number (source: WDC-SILSO, Royal Observatory of Belgium, Brussels, https://doi.org/10.24414/qnza-ac80).
Current usage metrics show cumulative count of Article Views (full-text article views including HTML views, PDF and ePub downloads, according to the available data) and Abstracts Views on Vision4Press platform.
Data correspond to usage on the plateform after 2015. The current usage metrics is available 48-96 hours after online publication and is updated daily on week days.
Initial download of the metrics may take a while.