Fig. 5.
Download original image
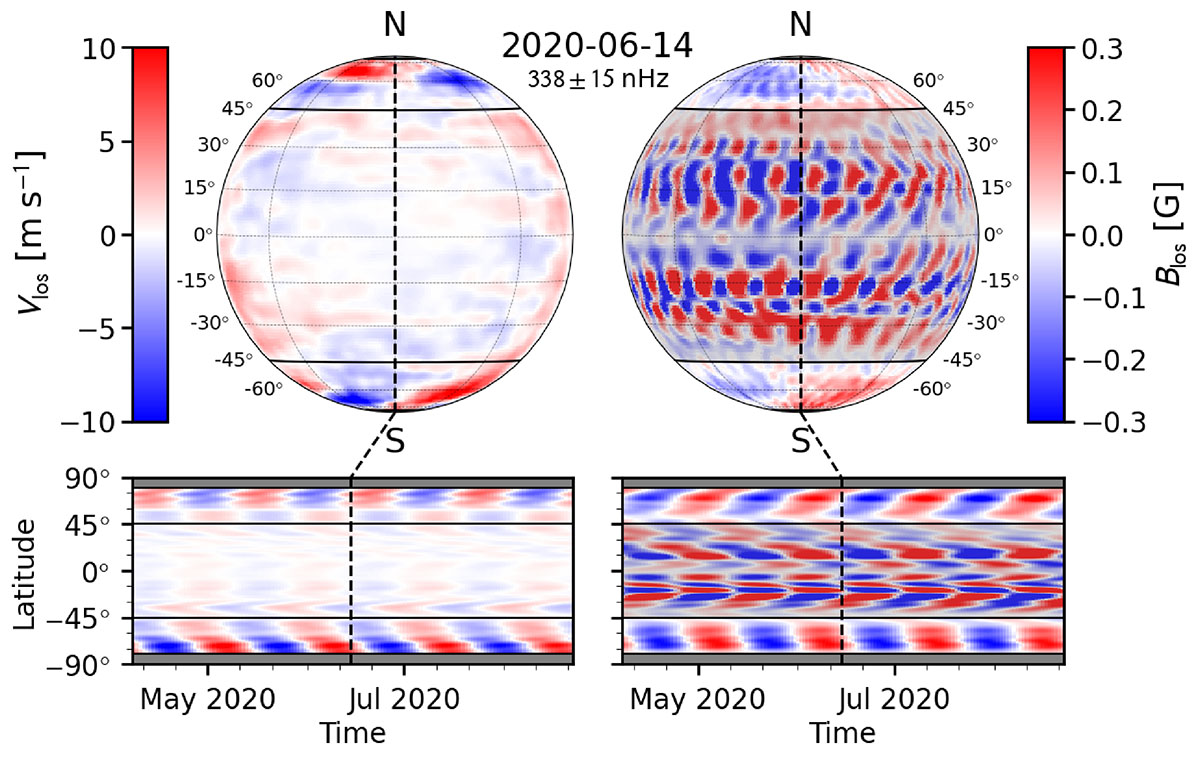
Bandpass-filtered images of the LOS Doppler velocity, Vlos, and LOS magnetic field, Blos, derived from HMI data. Top left: Filtered Vlos image from 14 June 2020. Bottom left: Central-meridian Vlos values stacked over time and plotted as a function of time and latitude. Right panels: Corresponding Blos data, with low-latitude regions (< 45°) shaded out. The filtering was performed using a bandpass filter centered at ![]() nHz with a full width of 30 nHz, applied over the entire available HMI time period, i.e., from 2010 to 2024. For clarity, the images were smoothed with a Gaussian kernel with a width of 2 pixel – in longitude and latitude (top panels) and in time and latitude (bottom panels). A movie is available as online supplementary material.
nHz with a full width of 30 nHz, applied over the entire available HMI time period, i.e., from 2010 to 2024. For clarity, the images were smoothed with a Gaussian kernel with a width of 2 pixel – in longitude and latitude (top panels) and in time and latitude (bottom panels). A movie is available as online supplementary material.
Current usage metrics show cumulative count of Article Views (full-text article views including HTML views, PDF and ePub downloads, according to the available data) and Abstracts Views on Vision4Press platform.
Data correspond to usage on the plateform after 2015. The current usage metrics is available 48-96 hours after online publication and is updated daily on week days.
Initial download of the metrics may take a while.