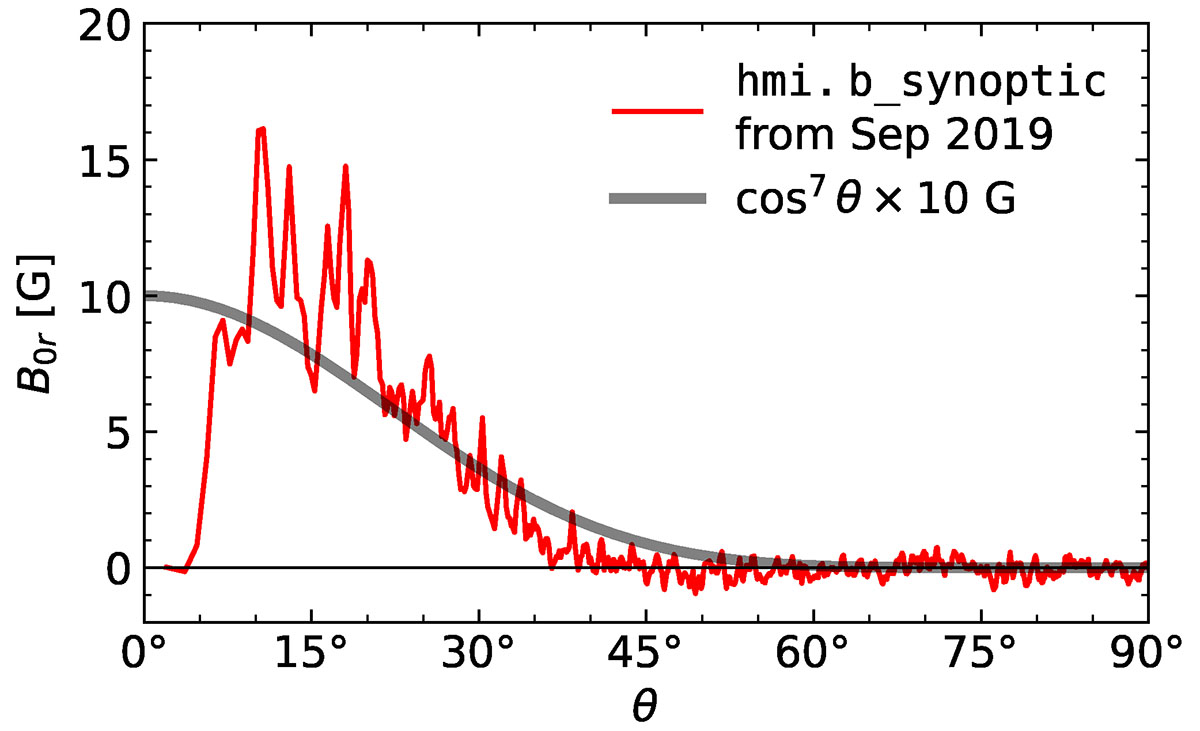
Fig. B.1.
Download original image
Background radial magnetic field during solar minimum estimated from the data series hmi.b_synoptic (Liu et al. 2017). The synoptic maps for the radial component of the magnetic field were stacked in time and then Gaussian-smoothed with a full width of 27 days. The red curve shows the data in the northern hemisphere on 15 September 2019, when the Sun was quiet and its north pole was tilted toward the Earth. The black curve shows the approximation B0r(θ) = 10 × (cos θ)7 G, which we use in Eqs. (B.5) and (B.6).
Current usage metrics show cumulative count of Article Views (full-text article views including HTML views, PDF and ePub downloads, according to the available data) and Abstracts Views on Vision4Press platform.
Data correspond to usage on the plateform after 2015. The current usage metrics is available 48-96 hours after online publication and is updated daily on week days.
Initial download of the metrics may take a while.