Fig. 2
Download original image
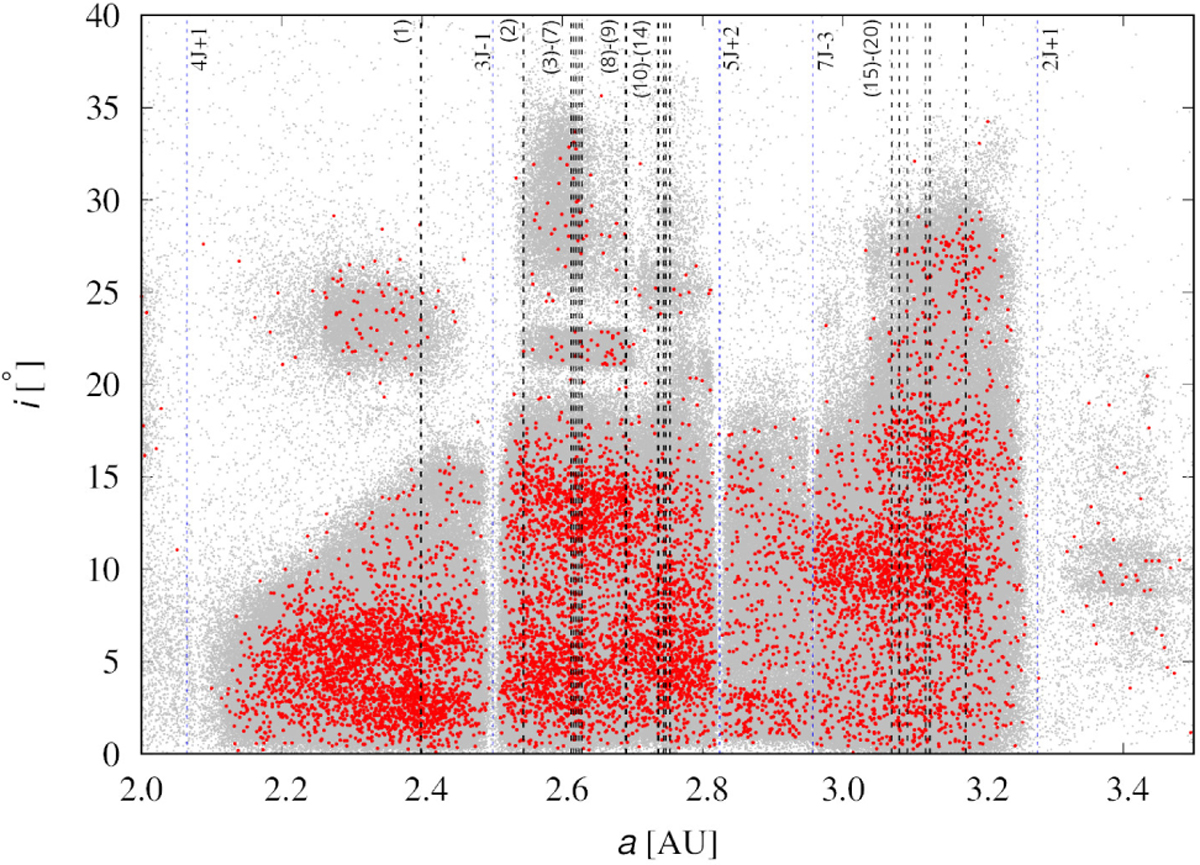
Main-belt asteroid distributions in (a, i) space. Gray dots show objects from the Minor Planet Center database and red dots show the selected sample. Dotted black lines mark the twenty most populated three-body MMRs from Table 2: (1) 4J-2S-1, (2) 2M+2J-5, (3) 2M-7J-2, (4) 2J+2S-1, (5) 6J-1S-2, (6) 4J-3S-1, (7) 3M-5J-5, (8) 1M-9J+1, (9) 1M-9S-1, (10) 1J-9S-1, (11) 2M-10J-1, (12) 1J+4S-1, (13) 5J+7S-3, (14) 3J-1S-1, (15) 1J+3S-1, (16) 3J-2S-1, (17) 5J-7S-1, (18) 1M-2J-2, (19) 1M-5S-2, and (20) 5J-2S-2. Blue vertical lines indicate five most important Kirkwood gaps in this region.
Current usage metrics show cumulative count of Article Views (full-text article views including HTML views, PDF and ePub downloads, according to the available data) and Abstracts Views on Vision4Press platform.
Data correspond to usage on the plateform after 2015. The current usage metrics is available 48-96 hours after online publication and is updated daily on week days.
Initial download of the metrics may take a while.