| Issue |
A&A
Volume 703, November 2025
|
|
|---|---|---|
| Article Number | C4 | |
| Number of page(s) | 4 | |
| Section | Stellar atmospheres | |
| DOI | https://doi.org/10.1051/0004-6361/202557625e | |
| Published online | 13 November 2025 | |
Detailed cool star flare morphology with CHEOPS and TESS (Corrigendum)
1
INAF, Osservatorio Astrofisico di Catania,
Via S. Sofia 78,
95123
Catania,
Italy
2
Department of Astronomy, Stockholm University, AlbaNova University Center,
10691
Stockholm,
Sweden
3
Astrophysics Group, Lennard Jones Building, Keele University,
Staffordshire
ST5 5BG,
UK
4
Weltraumforschung und Planetologie, Physikalisches Institut, University of Bern,
Gesellschaftsstrasse 6,
3012
Bern,
Switzerland
5
Center for Space and Habitability, University of Bern,
Gesellschaftsstrasse 6,
3012
Bern,
Switzerland
6
Instituto de Astrofisica e Ciencias do Espaco, Universidade do Porto, CAUP, Rua das Estrelas,
4150-762
Porto,
Portugal
7
Aix Marseille Univ, CNRS, CNES, LAM, 38 rue Frédéric Joliot-Curie,
13388
Marseille,
France
8
Space sciences, Technologies and Astrophysics Research (STAR) Institute, Université de Liège,
Allée du 6 Août 19C,
4000
Liège,
Belgium
9
HUN-REN-ELTE Exoplanet Research Group,
9700
Szombathely,
Szent Imre, h. u. 112,
Hungary
10
ELTE Gothard Astrophysical Observatory,
9700
Szombathely,
Szent Imre, h. u. 112,
Hungary
11
Astronomical Institute, Slovak Academy of Sciences,
05960
Tatranská Lomnica,
Slovakia
12
Konkoly Observatory, HUN-REN Research Centre for Astronomy and Earth Sciences,
Konkoly Thege út 15-17,
1121
Budapest,
Hungary
13
CSFK, MTA Centre of Excellence,
Budapest,
Konkoly Thege út 15-17,
1121
Hungary
14
Dipartimento di Fisica, Università degli Studi di Torino,
via Pietro Giuria 1,
10125
Torino,
Italy
15
Instituto de Astrofísica de Canarias, Vía Láctea s/n,
38200
La Laguna, Tenerife,
Spain
16
Departamento de Astrofísica, Universidad de La Laguna, Astrofísico Francisco Sanchez s/n,
38206
La Laguna, Tenerife,
Spain
17
Admatis,
5. Kandó Kálmán Street,
3534
Miskolc,
Hungary
18
Depto. de Astrofísica, Centro de Astrobiología (CSIC-INTA), ESAC campus,
28692
Villanueva de la Cañada (Madrid),
Spain
19
Departamento de Fisica e Astronomia, Faculdade de Ciencias, Universidade do Porto, Rua do Campo Alegre,
4169-007
Porto,
Portugal
20
Space Research Institute, Austrian Academy of Sciences,
Schmiedlstrasse 6,
8042
Graz,
Austria
21
Observatoire astronomique de l’Université de Genève,
Chemin Pegasi 51,
1290
Versoix,
Switzerland
22
INAF, Osservatorio Astronomico di Padova,
Vicolo dell’Osservatorio 5,
35122
Padova,
Italy
23
Centre for Exoplanet Science, SUPA School of Physics and Astronomy, University of St Andrews,
North Haugh,
St Andrews
KY16 9SS,
UK
24
Institute of Planetary Research, German Aerospace Center (DLR),
Rutherfordstrasse 2,
12489
Berlin,
Germany
25
INAF, Osservatorio Astrofisico di Torino,
Via Osservatorio, 20,
10025
Pino Torinese, To,
Italy
26
Centre for Mathematical Sciences, Lund University,
Box 118,
221 00
Lund,
Sweden
27
Astrobiology Research Unit, Université de Liège,
Allée du 6 Août 19C,
4000
Liège,
Belgium
28
Institute of Astronomy, KU Leuven,
Celestijnenlaan 200D,
3001
Leuven,
Belgium
29
Centre Vie dans l’Univers, Faculté des sciences, Université de Genève,
Quai Ernest-Ansermet 30,
1211
Genève 4,
Switzerland
30
Leiden Observatory, University of Leiden,
PO Box 9513,
2300
RA
Leiden,
The Netherlands
31
Department of Space, Earth and Environment, Chalmers University of Technology, Onsala Space Observatory,
439 92
Onsala,
Sweden
32
Department of Astrophysics, University of Vienna,
Türkenschanzstrasse 17,
1180
Vienna,
Austria
33
European Space Agency (ESA), European Space Research and Technology Centre (ESTEC),
Keplerlaan 1,
2201
AZ
Noordwijk,
The Netherlands
34
Institute for Theoretical Physics and Computational Physics, Graz University of Technology,
Petersgasse 16,
8010
Graz,
Austria
35
Konkoly Observatory, Research Centre for Astronomy and Earth Sciences,
1121
Budapest,
Konkoly Thege Miklós út 15-17,
Hungary
36
ELTE Institute of Physics,
Pázmány Péter sétány 1/A,
1117
Budapest,
Hungary
37
IMCCE, UMR8028 CNRS, Observatoire de Paris, PSL Univ., Sorbonne Univ.,
77 av. Denfert-Rochereau,
75014
Paris,
France
38
Institut d’astrophysique de Paris, UMR7095 CNRS, Université Pierre & Marie Curie,
98bis blvd. Arago,
75014
Paris,
France
39
Institute of Optical Sensor Systems, German Aerospace Center (DLR),
Rutherfordstrasse 2,
12489
Berlin,
Germany
40
Dipartimento di Fisica e Astronomia “Galileo Galilei”, Università degli Studi di Padova,
Vicolo dell’Osservatorio 3,
35122
Padova,
Italy
41
Department of Physics, University of Warwick,
Gibbet Hill Road,
Coventry
CV4 7AL,
UK
42
ETH Zurich, Department of Physics,
Wolfgang-Pauli-Strasse 2,
8093
Zurich,
Switzerland
43
Cavendish Laboratory,
JJ Thomson Avenue,
Cambridge
CB3 0HE,
UK
44
Institut fuer Geologische Wissenschaften, Freie Universitaet Berlin,
Maltheserstrasse 74-100,
12249
Berlin,
Germany
45
Institut de Ciencies de l’Espai (ICE, CSIC), Campus UAB, Can Magrans s/n,
08193
Bellaterra,
Spain
46
Institut d’Estudis Espacials de Catalunya (IEEC),
Gran Capità 2-4,
08034
Barcelona,
Spain
47
Institute of Astronomy, University of Cambridge,
Madingley Road,
Cambridge
CB3 0HA,
UK
★ Corresponding author: This email address is being protected from spambots. You need JavaScript enabled to view it.
Key words: methods: data analysis / techniques: photometric / stars: activity / stars: flare / planetary systems / errata, addenda
1 Bug in flare energy calculation
We highlight a bug in the part of our code used for deriving flare energy. In the main paper, this was obtained by multiplying the integral under the flare profile by the ‘flare peak’ luminosity: the ‘quiescent stellar’ luminosity should have been used instead. This error caused flare energy to be underestimated, especially for the smallest flares. This affects the statistics related to flare energy in our study.
In Figure 1, we report the updated plots for Figures 13 and 14 in the original paper. The updated Figure 13 (left panel) presents the updated distribution of flare energy for simple (single-peak) and complex (part of multi-peak) flares, which we confirm differ at a high level of significance (p ≪ 0.05). Updated Figure 14 (right panel) shows the flare duration-energy correlation. We recovered steeper correlations between flare duration d and energy E:
![Mathematical equation: $\[\log~ d_{\mathrm{s}}=\left(0.439_{-0.004}^{+0.005}\right) ~\log~ E_{\mathrm{s}}-13.2_{-0.2}^{+0.1}\]$](/articles/aa/full_html/2025/11/aa57625e-25/aa57625e-25-eq1.png) (1)
(1)
![Mathematical equation: $\[\log~ d_{\mathrm{c}}=(0.53 \pm 0.01) ~\log~ E_{\mathrm{c}}-(15.8 \pm 0.3)\]$](/articles/aa/full_html/2025/11/aa57625e-25/aa57625e-25-eq2.png) (2)
(2)
for simple (‘s’) and complex (‘c’) flares, respectively; here, duration is measured in minutes and energy in erg. The result is significantly different from Maehara et al. (2015)’s theoretical prediction, which states that d ∝ E1/3, but it might also be affected by an underestimate of flare parameter uncertainties.
Figure 2 is the updated version of Figure 15 in the original paper. The underestimation of flare energy increased the steepness of the impulse-energy relationship, which is now found to be less significant. The Spearman correlation coefficient confirms that the parameters are correlated, with p ≪ 0.05 at native cadence, and p ≃ 0.04 at binned cadence. More specifically, we found that the relationship becomes negative for flares at native cadence (3 s for CHEOPS and 20 s for TESS):
![Mathematical equation: $\[\log~ \mathcal{I}_{\mathrm{n}}=(-0.175 \pm 0.005) ~\log~ E_{\mathrm{n}}+(1.6 \pm 0.2)\]$](/articles/aa/full_html/2025/11/aa57625e-25/aa57625e-25-eq3.png) (3)
(3)
![Mathematical equation: $\[\log~ \mathcal{I}_{\mathrm{b}}=(0.07 \pm 0.01) ~\log~ E_{\mathrm{b}}-(6.7 \pm 0.2),\]$](/articles/aa/full_html/2025/11/aa57625e-25/aa57625e-25-eq4.png) (4)
(4)
where ‘n’ and ‘b’ denote ‘native’ and ‘binned’ cadence, respectively, impulse is measured in s−1, and energy in erg. Qualitatively, this confirms the importance of monitoring flares with the highest cadence possible in order to constrain flare impulse.
Figure 3 presents the updated plots for the flare energy power laws for simple and complex flares (left panel) and for partially convective versus fully convective stars (right panel), as reported in the top-left and top-right panels of Figure 16 in the original paper. We do not detect any significant preference for the power law over the log-normal modelling of the observed distributions, as p > 0.05 in all cases; in the original study, we found a significant preference for the log-normal description in the only case of the complex flare energy distribution. More importantly, we retrieved a significant increase in the power-law scaling factor α: in all cases, the value 2 is now included within 3σ uncertainties, as shown in Table 1. What we found is, however, compatible with recent results that attribute high scaling factors to small inertial ranges (Aschwanden & Scholkmann 2025); we chose to explore this issue in a subsequent publication.
Finally, in Figure 4 we present the updated distribution for the trends between the detected quasi-periodic pulsation (QPP) candidate energy, the amplitude ratio as described in Section 6.7 in the original paper (left panel), and the QPP estimated period (right panel). Qualitatively, we observe similar trends to those found in the previous paper, which we chose not to interpret due the small available sample size.
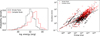 |
Fig. 1 Left: distribution of computed flare energies. Single-peaked and individual components of multi-peaked flares are coloured in black and red, respectively. Right: flare duration-energy correlation, with the same colour code. |
Fitted power-law coefficients α, normalised likelihood ratio R, corresponding p-value, and lower bound for the inertial range x1 for the cumulative distribution flare energy subsets.
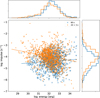 |
Fig. 2 Flare impulse as a function of flare energy for binned (blue crosses) and native (orange dots) cadence. The top and right histograms show energy and impulse distributions, respectively, with the same colour code. |
2 Summary of updated results
To conclude, we here summarise the updated conclusions of our study concerning flare energy in our sample:
Beginning with Hawley et al. (2014)’s finding that complex flares tend to be more energetic than simple flares, we focused on complex flare components and report that these are also statistically more energetic than simple flares. This might indicate a difference in the respective triggering mechanisms, which needs to be further investigated both from observational and theoretical standpoints;
We found a steeper relationship between flare duration and energy than Maehara et al. (2015)’s theoretical prediction on solar-type stars. However, we cannot exclude an underestimation of flare parameter uncertainties, which might make the difference less significant. This is due to the many free parameters that need to be fitted in complex flare profiles and the large number of flares to be analysed, which challenge a systematic and homogeneous quantification of parameter uncertainties for each outburst;
We found a significant correlation between flare impulse and energy, both at native (3 and 20 s for CHEOPS and TESS, respectively) and 1 min binned cadence. Overall, this confirms the need to monitor flares at the highest time cadence possible, in order to better assess their morphology and potential impact on close-in exoplanets;
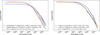
Fig. 3 Complementary cumulative distribution functions (CCDFs) for flare energy, and their power-law and log-normal distribution fits. Left: simple and complex flares are divided. Right: partially (<M3V) and fully (>M3V) convective stars are divided.
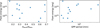
Fig. 4 QPP energy trends vs oscillation amplitude ratio (left) and period (right).
We failed to find a statistical preference for a log-normal modelling of the flare energy distributions compared to a power-law approach. The statistical preference was inspected for simple flares versus complex flare components, and for partially versus fully convective stars, where different dynamo processes are expected (e.g. Chabrier & Küker 2006);
The power-law scaling factors that we recovered for all examined subsets include the critical value 2 within 3σ uncertainties, in agreement with recent literature suggesting that observed scaling factors might be overestimated in the common case of small inertial ranges (e.g. Aschwanden & Scholkmann 2025). This highlights the need for enhancing both the precision of our surveys (to reduce the minimum flare energy that can be detected) and their duration (to increase the likelihood of detecting large and rare energy events, if they occur);
We confirmed tentative correlations between the energy of quasi-periodic pulsation candidates (i.e. the energy of the single-smoothed flare fitted to their profile) and their oscillation amplitude and period, as reported by Howard & MacGregor (2022). Larger samples are needed to further investigate these trends.
All in all, this update reinforces the need for large-sample statistical explorations of flare properties, such as those that will be made possible thanks to the PLATO yield.
3 Update to public code
We fixed the bug in the flare energy calculation in the code used for this study, available on GitHub1.
References
- Aschwanden, M. J., & Scholkmann, F. 2025, arXiv e-prints [arXiv:2505.00748] [Google Scholar]
- Chabrier, G., & Küker, M. 2006, A&A, 446, 1027 [NASA ADS] [CrossRef] [EDP Sciences] [Google Scholar]
- Hawley, S. L., Davenport, J. R. A., Kowalski, A. F., et al. 2014, ApJ, 797, 121 [Google Scholar]
- Howard, W. S., & MacGregor, M. A. 2022, ApJ, 926, 204 [NASA ADS] [CrossRef] [Google Scholar]
- Maehara, H., Shibayama, T., Notsu, Y., et al. 2015, Earth Planets Space, 67, 59 [NASA ADS] [CrossRef] [Google Scholar]
© The Authors 2025
 Open Access article, published by EDP Sciences, under the terms of the Creative Commons Attribution License (https://creativecommons.org/licenses/by/4.0), which permits unrestricted use, distribution, and reproduction in any medium, provided the original work is properly cited.
This article is published in open access under the Subscribe to Open model. This email address is being protected from spambots. You need JavaScript enabled to view it. to support open access publication.
All Tables
Fitted power-law coefficients α, normalised likelihood ratio R, corresponding p-value, and lower bound for the inertial range x1 for the cumulative distribution flare energy subsets.
All Figures
|
Fig. 1 Left: distribution of computed flare energies. Single-peaked and individual components of multi-peaked flares are coloured in black and red, respectively. Right: flare duration-energy correlation, with the same colour code. |
| In the text | |
|
Fig. 2 Flare impulse as a function of flare energy for binned (blue crosses) and native (orange dots) cadence. The top and right histograms show energy and impulse distributions, respectively, with the same colour code. |
| In the text | |
|
Fig. 3 Complementary cumulative distribution functions (CCDFs) for flare energy, and their power-law and log-normal distribution fits. Left: simple and complex flares are divided. Right: partially (<M3V) and fully (>M3V) convective stars are divided. |
| In the text | |
|
Fig. 4 QPP energy trends vs oscillation amplitude ratio (left) and period (right). |
| In the text | |
Current usage metrics show cumulative count of Article Views (full-text article views including HTML views, PDF and ePub downloads, according to the available data) and Abstracts Views on Vision4Press platform.
Data correspond to usage on the plateform after 2015. The current usage metrics is available 48-96 hours after online publication and is updated daily on week days.
Initial download of the metrics may take a while.