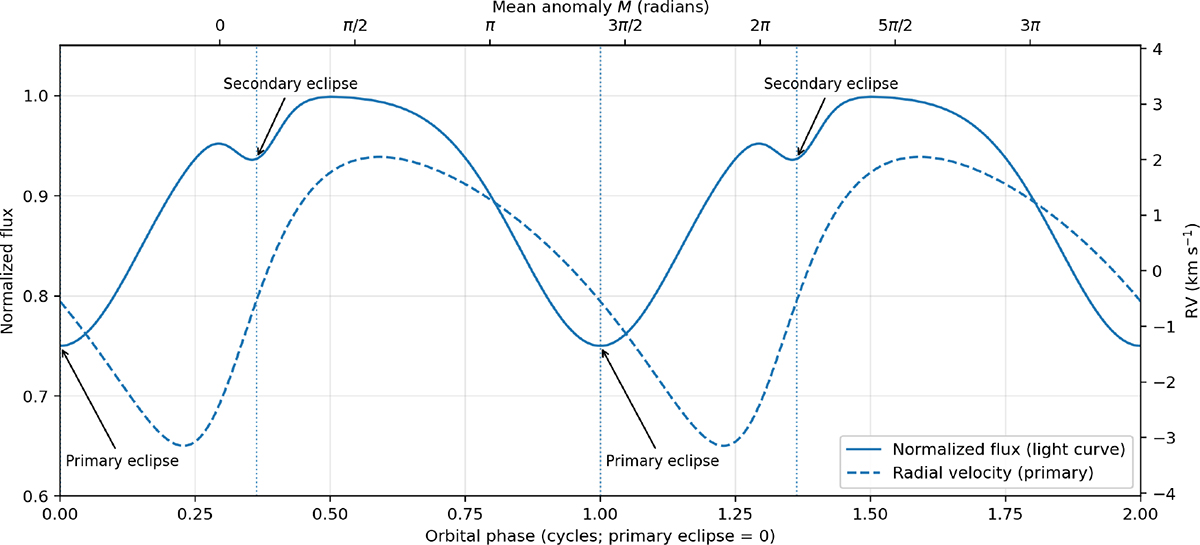
Fig. A.1.
Download original image
Relation between the orbital light curve (solid) and the radial-velocity curve (dashed) for an eclipsing binary with e = 0.3, ω = 225°, and i = 60°. The bottom axis shows the normalised orbital phase, while the top axis indicates the corresponding mean anomaly M. Dotted vertical lines mark the epochs of primary and secondary eclipses. For a circular, edge-on orbit, the primary’s RV minimum is a quarter of an orbital cycle (π/2) later in phase than the light curve minimum (primary eclipse); for eccentric orbits, this offset depends on both e and ω.
Current usage metrics show cumulative count of Article Views (full-text article views including HTML views, PDF and ePub downloads, according to the available data) and Abstracts Views on Vision4Press platform.
Data correspond to usage on the plateform after 2015. The current usage metrics is available 48-96 hours after online publication and is updated daily on week days.
Initial download of the metrics may take a while.