Fig. 1.
Download original image
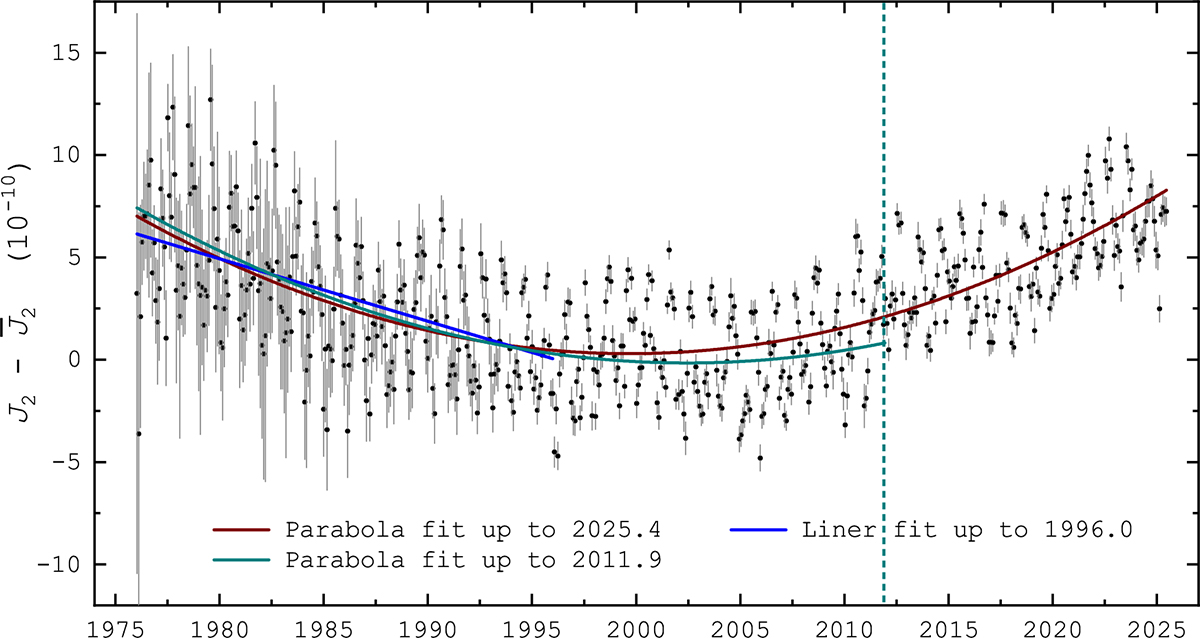
Earth’s J2 values evaluated from SLR and its long-term variation. The constant ![]() is the mean value for J2, which equals 0.0010826359797. The original data with continuous updates to 2025 are provided by Cheng et al. (2013). The error bars are shown in gray. The green dashed line indicates the endpoint of the data that were used in LC17. The linear and parabolic fits within different time intervals are shown as colored curves.
is the mean value for J2, which equals 0.0010826359797. The original data with continuous updates to 2025 are provided by Cheng et al. (2013). The error bars are shown in gray. The green dashed line indicates the endpoint of the data that were used in LC17. The linear and parabolic fits within different time intervals are shown as colored curves.
Current usage metrics show cumulative count of Article Views (full-text article views including HTML views, PDF and ePub downloads, according to the available data) and Abstracts Views on Vision4Press platform.
Data correspond to usage on the plateform after 2015. The current usage metrics is available 48-96 hours after online publication and is updated daily on week days.
Initial download of the metrics may take a while.