Open Access
Fig. D.1.
Download original image
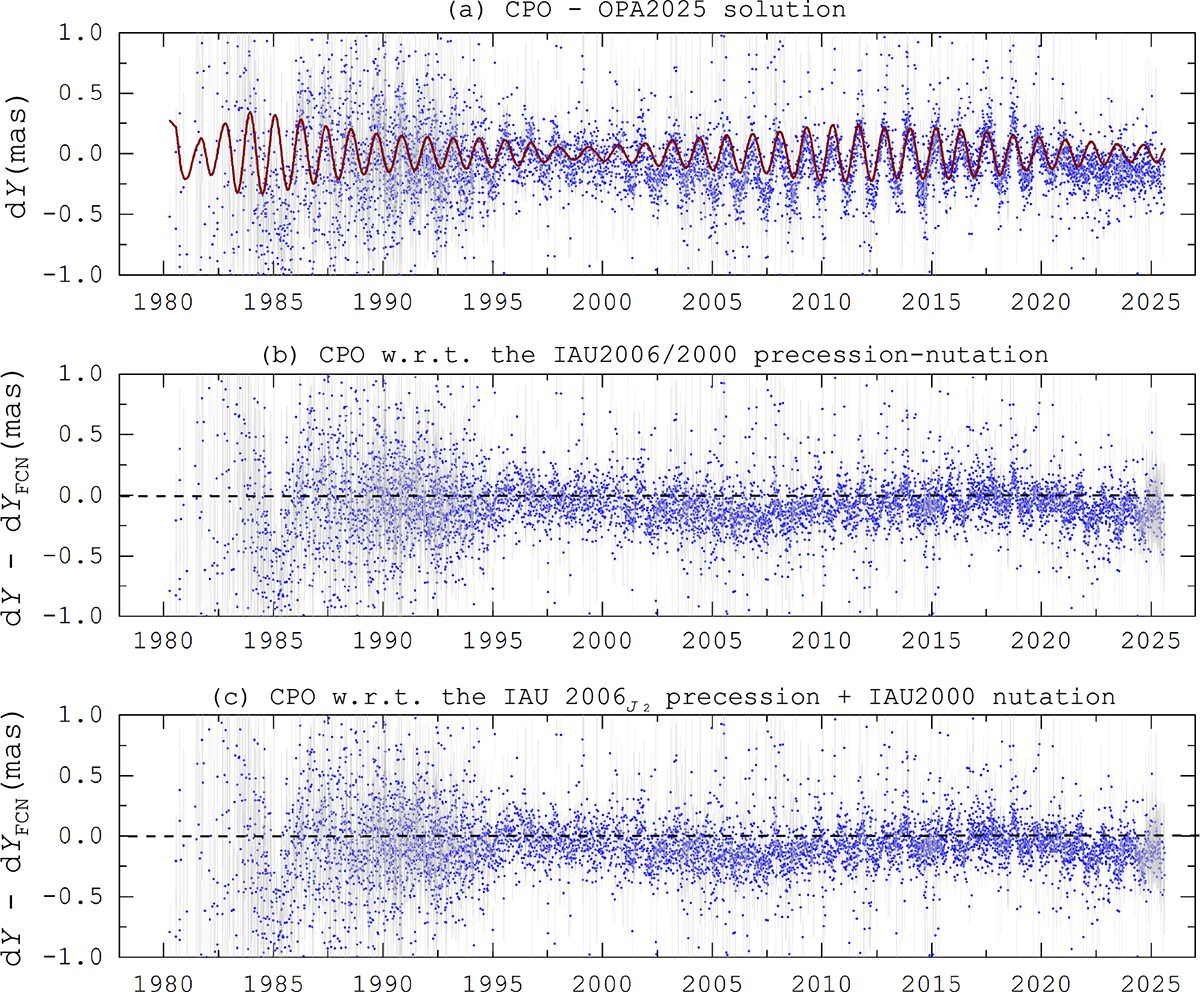
The dY component of CPO series from the OPA2025a solution. Panel (a) shows the original CPOs and the empirical FCN model (the red curve). Panels (b) and (c) are the CPOs after removing the FCN effect, corresponding to the IAU 2006J2 and the IAU 2006 precession models, respectively.
Current usage metrics show cumulative count of Article Views (full-text article views including HTML views, PDF and ePub downloads, according to the available data) and Abstracts Views on Vision4Press platform.
Data correspond to usage on the plateform after 2015. The current usage metrics is available 48-96 hours after online publication and is updated daily on week days.
Initial download of the metrics may take a while.