Fig. 14.
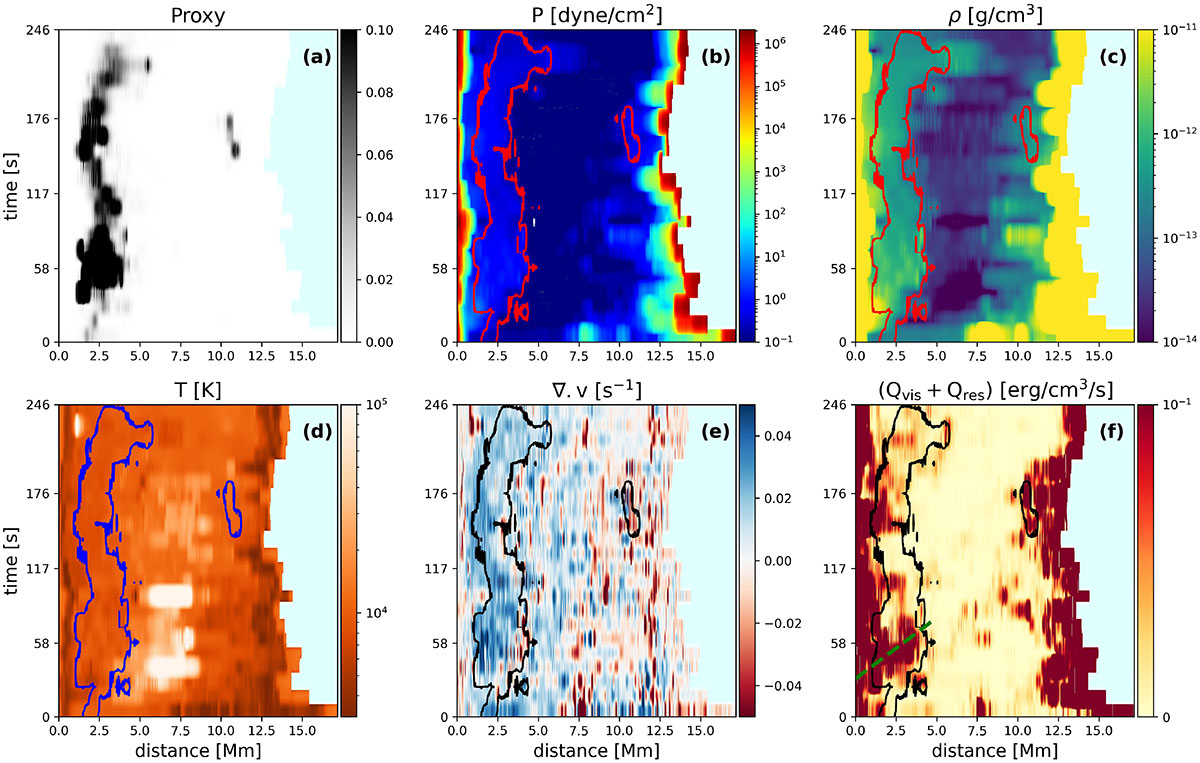
Download original image
Time-distance plots of various MHD quantities along the selected field line (dashed green line in Fig. 12). Panel (a) shows the evolution of the feature in the proxy. Panels (b), (c), and (d) show the gas pressure, density, and temperature, respectively. Panel (e) shows the divergence of flows, highlighting regions of compression (red)/expansion (blue). Panel (f) shows the viscous and resistive heating rate where the dashed green line shows the Alfvén speed in the region of the feature at ∼100 km/s. Contour lines highlight the location of the feature in panels (b)–(f). The length of the traced field lines change with time within the domain, so the data is padded with zeros on the right. This is shown with the light cyan colour.
Current usage metrics show cumulative count of Article Views (full-text article views including HTML views, PDF and ePub downloads, according to the available data) and Abstracts Views on Vision4Press platform.
Data correspond to usage on the plateform after 2015. The current usage metrics is available 48-96 hours after online publication and is updated daily on week days.
Initial download of the metrics may take a while.