| Issue |
A&A
Volume 703, November 2025
|
|
|---|---|---|
| Article Number | C3 | |
| Number of page(s) | 3 | |
| Section | The Sun and the Heliosphere | |
| DOI | https://doi.org/10.1051/0004-6361/202557716e | |
| Published online | 07 November 2025 | |
Probing chromospheric fine structures with a Hα proxy using MURaM-ChE (Corrigendum)
1
Max Planck Institute for Solar System Research, Justus von Liebig Weg, 37077 Göttingen, Germany
2
Institute for Solar Physics, Dept. of Astronomy, Stockholm University, Albanova University Center, 10691 Stockholm, Sweden
⋆ Corresponding author: This email address is being protected from spambots. You need JavaScript enabled to view it.
Key words: errata, addenda / Sun: chromosphere / Sun: magnetic fields
In the recently published article (Chandra et al. 2025), the colour bars in Figs. 12, 14, and 15 were incorrect for the divergence of the flow field (panel e, Fig. 14) and the forces (Figs. 12 and 15), as were the units. The reported forces correspond to force densities measured in dyne/cm3. The divergence of the flows should have units of s−1. The corrected figures are provided below. The movie associated with Fig. 12 has been updated. The captions remain unchanged.
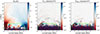 |
Fig. 12. Snapshot showing the vertical field and forces after flux emergence with a highly kinked field. The vertical component of the magnetic field (Bz) and the Lorentz (FL, z), and net forces (Fnet, z) is shown. The traced field line containing the feature is shown by the dashed green line. The evolution of these forces and fields is available online. |
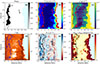 |
Fig. 14. Time-distance plots of various MHD quantities along the selected field line (dashed green line in Fig. 12). Panel (a) shows the evolution of the feature in the proxy. Panels (b), (c), and (d) show the gas pressure, density, and temperature, respectively. Panel (e) shows the divergence of flows, highlighting regions of compression (red)/expansion (blue). Panel (f) shows the viscous and resistive heating rate where the dashed green line shows the Alfvén speed in the region of the feature at ∼100 km/s. Contour lines highlight the location of the feature in panels (b)–(f). The length of the traced field lines change with time within the domain, so the data is padded with zeros on the right. This is shown with the light cyan colour. |
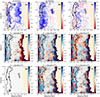 |
Fig. 15. Time-distance plots for the projection of flows and forces in the tangential (T), normal (N) and binormal (B) directions, respectively. Panels (a)–(c): flows projected in the T, N, B directions in the frame of reference of the selected field line. Panels (d)–(f) are the same for the net pressure gradient forces. Panels (g)–(i) show the Lorentz forces projected in the T, N, B directions. The dashed purple line in panel (b) marks the apparent velocity of propagation along the field line which is 50 km/s. The apparent velocity of the feature itself marked by the dashed magenta line is 38 km/s. Black contours highlight the location of the feature in all the panels. The padding on the right is indicated by the light orange colour. |
Correspondingly, there are minor revisions in the text that do not affect our main results. They are listed as follows:
In panel (e), Fig. 14 the divergence of the flows was reported as convergence. In the text two corrections address this: In Sect. 4.5.2 the last sentence of the second paragraph should read, ‘In panel (e), we see the flow field’s divergence, with the black-coloured contoured feature distinctly dominated by expansion’. In the third sentence of the sixth paragraph in the ‘Discussion and conclusions’, the text should read as, ‘Reconnection follows, and a divergence of flows in the region of the feature is clearly visible (panel e, Fig. 14)’. The sixth sentence in the same paragraph should read, ‘The reconnection outflow (panel a, Fig. 15) hits previously slow-moving gas, resulting in the local enhancement of the plasma density and pressure’.
Data availability
Updated movie is available at https://www.aanda.org
References
- Chandra, S., Cameron, R., Przybylski, D., et al. 2025, A&A, 701, A294 [NASA ADS] [CrossRef] [EDP Sciences] [Google Scholar]
© The Authors 2025
 Open Access article, published by EDP Sciences, under the terms of the Creative Commons Attribution License (https://creativecommons.org/licenses/by/4.0), which permits unrestricted use, distribution, and reproduction in any medium, provided the original work is properly cited.
This article is published in open access under the Subscribe to Open model.
Open Access funding provided by Max Planck Society.
All Figures
|
Fig. 12. Snapshot showing the vertical field and forces after flux emergence with a highly kinked field. The vertical component of the magnetic field (Bz) and the Lorentz (FL, z), and net forces (Fnet, z) is shown. The traced field line containing the feature is shown by the dashed green line. The evolution of these forces and fields is available online. |
| In the text | |
|
Fig. 14. Time-distance plots of various MHD quantities along the selected field line (dashed green line in Fig. 12). Panel (a) shows the evolution of the feature in the proxy. Panels (b), (c), and (d) show the gas pressure, density, and temperature, respectively. Panel (e) shows the divergence of flows, highlighting regions of compression (red)/expansion (blue). Panel (f) shows the viscous and resistive heating rate where the dashed green line shows the Alfvén speed in the region of the feature at ∼100 km/s. Contour lines highlight the location of the feature in panels (b)–(f). The length of the traced field lines change with time within the domain, so the data is padded with zeros on the right. This is shown with the light cyan colour. |
| In the text | |
|
Fig. 15. Time-distance plots for the projection of flows and forces in the tangential (T), normal (N) and binormal (B) directions, respectively. Panels (a)–(c): flows projected in the T, N, B directions in the frame of reference of the selected field line. Panels (d)–(f) are the same for the net pressure gradient forces. Panels (g)–(i) show the Lorentz forces projected in the T, N, B directions. The dashed purple line in panel (b) marks the apparent velocity of propagation along the field line which is 50 km/s. The apparent velocity of the feature itself marked by the dashed magenta line is 38 km/s. Black contours highlight the location of the feature in all the panels. The padding on the right is indicated by the light orange colour. |
| In the text | |
Current usage metrics show cumulative count of Article Views (full-text article views including HTML views, PDF and ePub downloads, according to the available data) and Abstracts Views on Vision4Press platform.
Data correspond to usage on the plateform after 2015. The current usage metrics is available 48-96 hours after online publication and is updated daily on week days.
Initial download of the metrics may take a while.