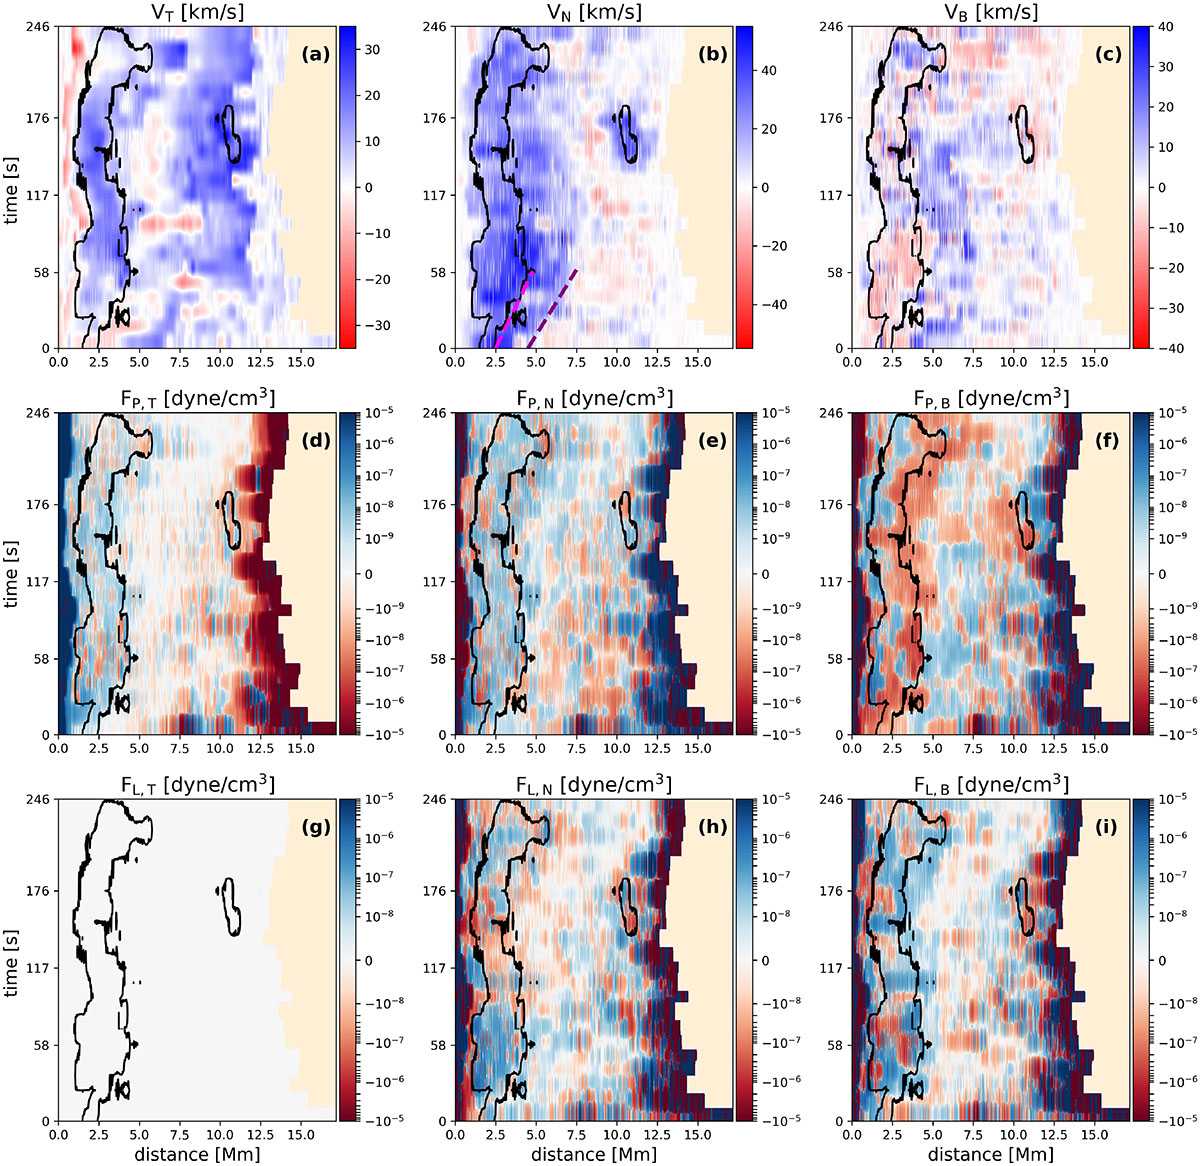
Fig. 15.
Download original image
Time-distance plots for the projection of flows and forces in the tangential (T), normal (N) and binormal (B) directions, respectively. Panels (a)–(c): flows projected in the T, N, B directions in the frame of reference of the selected field line. Panels (d)–(f) are the same for the net pressure gradient forces. Panels (g)–(i) show the Lorentz forces projected in the T, N, B directions. The dashed purple line in panel (b) marks the apparent velocity of propagation along the field line which is 50 km/s. The apparent velocity of the feature itself marked by the dashed magenta line is 38 km/s. Black contours highlight the location of the feature in all the panels. The padding on the right is indicated by the light orange colour.
Current usage metrics show cumulative count of Article Views (full-text article views including HTML views, PDF and ePub downloads, according to the available data) and Abstracts Views on Vision4Press platform.
Data correspond to usage on the plateform after 2015. The current usage metrics is available 48-96 hours after online publication and is updated daily on week days.
Initial download of the metrics may take a while.