| Issue |
A&A
Volume 703, November 2025
|
|
|---|---|---|
| Article Number | L22 | |
| Number of page(s) | 6 | |
| Section | Letters to the Editor | |
| DOI | https://doi.org/10.1051/0004-6361/202557754 | |
| Published online | 24 November 2025 | |
Letter to the Editor
Detection of six isotopologues of CH3CCCCH in TMC-1 with the QUIJOTE line survey
1
Dept. de Astrofísica Molecular, Instituto de Física Fundamental (IFF-CSIC), C/ Serrano 121, 28006 Madrid, Spain
2
LUX, Observatoire de Paris, PSL Research University, CNRS, Sorbonne Universités, 92190 Meudon, France
3
Observatorio Astronómico Nacional (OAN, IGN), C/ Alfonso XII, 3, 28014 Madrid, Spain
4
Observatorio de Yebes, IGN, Cerro de la Palera s/n, 19141 Yebes, Guadalajara, Spain
⋆ Corresponding authors: This email address is being protected from spambots. You need JavaScript enabled to view it.
; This email address is being protected from spambots. You need JavaScript enabled to view it.
Received:
19
October
2025
Accepted:
4
November
2025
Abstract
We present the detection of the five 13C isotopologues and the acetylenic deuterated species of CH3C4H towards TMC-1 using observations from the QUIJOTE line survey taken with the Yebes 40m telescope. The identification of the CH3C13CCCH and CH3CCCCD species was based on previous laboratory spectroscopic data. In contrast, for the remaining 13C species, 13CH3CCCCH, CH313CCCCH, CH3CC13CCH, and CH3CCC13CH, we carried out the spectroscopic identification directly in the QUIJOTE data. In this manner, the molecular constants derived in this work constitute the first spectroscopy information of these four species. We find that 12C/13C is 93 ± 11 for the five possible substitutions, and that the H/D abundance ratio is 54.2 ± 7.8. As previously reported, the TMC-1 gas-phase chemical model with multiply deuterated molecules accounts for the CH3C4H/CH3C4D abundance ratio calculated in this work.
Key words: astrochemistry / line: identification / molecular data / ISM: molecules / ISM: individual objects: TMC-1
© The Authors 2025
 Open Access article, published by EDP Sciences, under the terms of the Creative Commons Attribution License (https://creativecommons.org/licenses/by/4.0), which permits unrestricted use, distribution, and reproduction in any medium, provided the original work is properly cited.
This article is published in open access under the Subscribe to Open model. This email address is being protected from spambots. You need JavaScript enabled to view it. to support open access publication.
1. Introduction
The QUIJOTE1 line survey (Cernicharo et al. 2021a) performed with the Yebes 40m radio telescope towards the starless cold core Taurus molecular cloud (TMC-1) has enabled the discovery of more than 60 molecules in recent years, including polycyclic aromatic hydrocarbons (Cernicharo et al. 2024a; Cabezas et al. 2025), sulphur-bearing species (Cernicharo et al. 2021b), and radicals (Agúndez et al. 2021). The extreme sensitivity of QUIJOTE, which is unprecedented, enables the detection of, in addition to new molecular species, the features of the isotopologues of each molecule that exhibits lines with intensities higher than ∼50 mK (Cernicharo et al. 2024b). For very abundant species with extremely strong signals, doubly substituted isotopologues can also be observed; this has been done for doubly substituted species of HCCCN (Tercero et al. 2024).
Isotopologue abundance ratios provide a powerful tool for tracing the origin and evolution of the molecular material in the process of star and planetary system formation, enabling the chemical evolution of the Milky Way to be constrained (Yan et al. 2023). For example, the 12C/13C ratio is one of the most useful tracers of the relative degree of primary to secondary processing (Timmes et al. 1995), and the deuterium fractionation has been shown to be a useful tool for tracing the evolution of the chemical composition in low-mass star-forming regions (Ceccarelli et al. 2014). In this work we report the detection in TMC-1 of six singly substituted isotopologues of CH3C4H, namely 13CH3CCCCH, CH313CCCCH, CH3C13CCCH, CH3CC13CCH, CH3CCC13CH, and CH3CCCCD. One of the 13C species, CH3C13CCCH, and the deuterated form CH3CCCCD have previously been observed in the laboratory (Cazzoli et al. 2008; Heath et al. 1955), but for the other four the spectroscopic data obtained in this work are the first experimental information ever reported for these isotopologues. In a previous work, we presented the detection of the singly substituted isotopologue CH2DCCCCH (Cabezas et al. 2022), which is more abundant than the isotopologues detected in the present work. However, the increase in sensitivity of our QUIJOTE data from 2022 to today (Cernicharo et al. 2024a) has allowed us to identify all the remaining singly substituted isotopic species of CH3C4H.
2. Observations
The astronomical observations presented in this work are from the ongoing Yebes 40m Q band line survey of TMC-1 QUIJOTE. A detailed description of the line survey and the data-analysis procedure is provided in Cernicharo et al. (2021a, 2022). Briefly, QUIJOTE consists of a line survey in the Q band (31.0−50.3 GHz) at the position of the cyanopolyyne peak of TMC-1 (αJ2000 = 4h41m41.9s and δJ2000 = +25° 41′27.0″). This survey was carried out using a receiver built within the Nanocosmos project2 consisting of two cooled high-electron-mobility-transistor amplifiers covering the Q band with horizontal and vertical polarization. Fast Fourier transform spectrometers with 8 × 2.5 GHz and a spectral resolution of 38.15 kHz provide the whole coverage of the Q band in both polarizations. Receiver temperatures are 16 K at 32 GHz and 30 K at 50 GHz. The experimental setup is described in detail by Tercero et al. (2021).
All observations were performed using the frequency-switching observing mode with a frequency throw of 10 and 8 MHz. The total observing time on the source for data taken with frequency throws of 10 MHz and 8 MHz is 772.6 and 736.6 hours, respectively (Cernicharo et al. 2024a). Hence, the total observing time on source is 1509.2 hours. The QUIJOTE sensitivity varies between 0.06 mK at 32 GHz and 0.18 mK at 49.5 GHz. The main beam efficiency can be given across the Q band as Beff = 0.797 exp[−(ν(GHz)/71.1)2]. The forward telescope efficiency is 0.97. The telescope beam size at half power intensity is 54.4″ at 32.4 GHz and 36.4″ at 48.4 GHz. The absolute calibration uncertainty is 10%. The data were analysed with the GILDAS package3.
3. Results and discussion
Line identification in this work was performed using the MADEX code (Cernicharo 2012) in conjunction with the Cologne Database for Molecular Spectroscopy (Müller et al. 2005) and the Jet Propulsion Laboratory (Pickett et al. 1998) catalogues. The references and laboratory data used by MADEX in its spectroscopic predictions are described below.
Methyldiacetylene (CH3C4H) was discovered in TMC-1 by Walmsley et al. (1984), and the detection of its deuterated isotopologue CH2DC4H was recently reported by our group (Cabezas et al. 2022). The identification of this deuterated form of CH3C4H was achieved by observing 12 rotational transitions in TMC-1 that perfectly agreed with the predictions obtained by ab initio calculations. The theoretical rotational constants calculated at the CCSD/cc-pVTZ level of theory (Purvis & Bartlett 1982; Dunning 1989) were improved following the empirical scaling procedure for each spectroscopic parameter (X):
 (1)
(1)
where i and p refer to the isotopic-substituted and parent species, respectively, and scal, exp, and ab denote the scaled, experimental, and ab initio calculated values for X. This procedure is known to provide good estimates, with a precision of better than 0.1% (Cabezas et al. 2021a,b, 2022).
In this work we followed the same methodology for the four 13C substituted isotopologues 13CH3CCCCH, CH313CCCCH, CH3CC13CCH, and CH3CCC13CH, for which no spectroscopic data were known. The scaled B rotational constants for these four species, shown in Table 1, were used to obtain frequency predictions in the Q-band range. We found doublets of lines, corresponding to the K = 0 and K = 1 components, very close to the predicted frequencies for the lines with J quantum numbers from 8 to 12 for each of these four isotopologues (see Fig. 1). In the case of the isotopologues CH3C13CCCH and CH3CCCCD, we used the rotational parameters derived from laboratory measurements by Cazzoli et al. (2008) and Heath et al. (1955), respectively, to predict the frequency transitions in the Q band. As for the other isotopic species, we found doublets of lines at the predicted frequencies for the lines with J quantum numbers from 8 to 12 for CH3C13CCCH and from 9 to 12 for CH3CCCCD. The line parameters for all the observed lines are given in Table A.1.
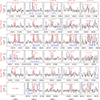 |
Fig. 1. Observed lines for the six isotopologues of CH3CCCCH in TMC-1 in the 31.0−50.4 GHz range. Frequencies and line parameters are given in Table A.1. Quantum numbers for the observed transitions are indicated in each panel. The red line shows the synthetic spectrum computed for a rotational temperature of 9 K and the column densities from Table 1. Blank channels correspond to negative features created during the folding of the frequency-switching data. |
Molecular constants and column densities derived in this work for the isotopologues of CH3C4H.
All the doublets of lines for each isotopologue were assigned to the K = 0 and K = 1 components of each J′–J″ transition. In the cases of 13CH3CCCCH, CH313CCCCH, CH3CC13CCH, and CH3CCC13CH species, we analysed the QUIJOTE rotational transitions using a standard symmetric rotor Hamiltonian to derive the rotational and centrifugal distortion constants listed in Table 1. For CH3CCCCD we made a merged fit with the lines observed by Heath et al. (1955), deriving the molecular parameters shown in Table 1. Finally, for CH3C13CCCH we did not attempt to fit our lines, a total of eight, with the 65 lines observed by Cazzoli et al. (2008) since the effect of our lines in the molecular constants would be negligible.
We analysed the intensities of the lines of each isotopologue to derive the column density of each species. We adopted a dipole moment value for all the isotopic species identical to that of the main isotopologue CH3C4H (1.207 D; Bester et al. 1984). We assumed a source with a uniform brightness temperature and a radius of 40″, as derived from the molecular maps by Fossé et al. (2001), Cernicharo et al. (2023), and Fuentetaja et al. (2025), to estimate the dilution factor for each transition. We also adopted a rotational temperature of 9 K, which is the gas kinetic temperature in TMC-1 (Agúndez et al. 2023). The values of the column densities for the six isotopic species of CH3C4H are shown in Table 1. As seen in Fig. 1, the agreement between the synthetic spectrum and the observations is very good. The column density is not very sensitive to the adopted value of the rotational temperature between 6 and 10 K. The line width adopted in the model to compute the synthetic spectra was 0.6 km s−1 for all lines.
As mentioned before, in a previous investigation (Cabezas et al. 2022) we detected the deuterated form of CH3CCCCH, CH2DCCCCH, in TMC-1 and searched for CH3CCCCD. Using the less sensitive data of the QUIJOTE line survey in 2022, we did not detect CH3CCCCD but calculated a 3σ upper limit to its column density (Cabezas et al. 2022). The reported value for this upper limit was 9 × 1010 cm−2. This value applies to each of the A and E symmetry states, and the upper limit to the column density of CH3CCCCD calculated in 2021 was 1.8 × 1011 cm−2. Hence, the column density of CH3CCCCD obtained in this work, (2.4 ± 0.2) × 1011 cm−2, is in line with the 3σ upper limit calculated by Cabezas et al. (2022). The detection of CH3CCCCD allowed us to constrain the H/D abundance ratio for CH3C4H as CH3C4H/CH3C4D = 54.2 ± 7.8, adopting the column density value derived in Cernicharo et al. (2021c) for CH3CCCCH, (1.30 ± 0.08) × 1013 cm−2.
We already investigated the chemical processes leading to deuterium insertion in CH3C4H and CH3C3N to form CH2DC4H (Cabezas et al. 2022) and CH2DC3N (Cabezas et al. 2021b), respectively, by extending our previous study on H2CCN and HDCCN (Cabezas et al. 2021a). We present in Table 2 the observed deuterium fractions of the molecules that contain a methyl group; they are compared to the results of our steady-state chemical model4 in which two different scenarios were considered when including deuterium in the chemical network. We wanted to check if the reactions proceed straightforwardly (model A) or via an activated complex followed by statistical redistribution (model B). We show a particular example of considered branching ratios involved in the reaction between C2D and CH3CCH in Table 3, but such assumptions occur many times in the chemical network.
Deuteration fractions of methyl-group-containing molecules in TMC-1 compared to gas-phase chemical model results.
Branching ratios for the deuterated version of the C2H + C3H4 reactions, including propyne CH3CCH and 1, 2-propadiene CH2 = C = CH2.
The observed deuterium fractions are reasonably well reproduced in the B-type model involving an activated complex. As shown in Table 1, all five 13C isotopologues for CH3CCCCH show the same abundance, (1.4 ± 0.3) × 1011 cm−2. In this manner, we found a 12C/13C of 93 ± 11 for the five possible substitutions in CH3CCCCH molecules. This ratio is consistent with the Solar System value of 89 (Wilson & Rood 1994). The present observations should motivate the construction of theoretical models. However, including the dependence of the 13C position in such large carbon chains is subject to many uncertainties regarding the involved chemical processes and leads to a considerable increase in the number of equations and chemical reactions.
4. Conclusions
The QUIJOTE survey of TMC-1 allowed us to identify the five 13C isotopologues of CH3C4H and the deuterated species CH3C4D – the other deuterated species CH2DC4H having been detected before. The singly substituted isotopologues 13CH3CCCCH, CH313CCCCH, CH3C13CCCH, CH3CC13CCH, CH3CCC13CH, and CH3CCCCD were detected through their J = 8−12 rotational transitions. We derive the same column density for the five 13C isotopologues, which imply a 12C/13C ratio of 93 ± 11, in line with the Solar System value. It seems, therefore, that there is no significant 13C isotopic fractionation for CH3C4H.
Q-band Ultrasensitive Inspection Journey to the Obscure TMC-1 Environment.
Some reactions have been updated compared to Cabezas et al. (2021b), leading to minor differences.
Acknowledgments
This work was based on observations carried out with the Yebes 40m telescope (projects 19A003, 20A014, 20D023, 21A011, 21D005, and 23A024). The 40m radiotelescope at Yebes Observatory is operated by the Spanish Geographic Institute (IGN, Ministerio de Transportes y Movilidad Sostenible). We acknowledge funding support from Spanish Ministerio de Ciencia e Innovación through grants PID2022-137980NB-100 and PID2023-147545NB-I00. This work was also partially supported by the Thematic Action ‘Physique et Chimie du Milieu Interstellaire’ (PCMI) of INSU, Programme National Astro, with contributions from CNRS Physique & CNRS Chimie, CEA, and CNES.
References
- Agúndez, M., Cabezas, C., Tercero, B., et al. 2021, A&A, 647, L10 [EDP Sciences] [Google Scholar]
- Agúndez, M., Marcelino, N., Tercero, B., et al. 2023, A&A, 677, A106 [NASA ADS] [CrossRef] [EDP Sciences] [Google Scholar]
- Bester, M., Yamada, K. M. T., Winnewisser, G., et al. 1984, A&A, 137, L20 [NASA ADS] [Google Scholar]
- Cabezas, C., Endo, Y., Roueff, E., et al. 2021a, A&A, 646, L1 [NASA ADS] [CrossRef] [EDP Sciences] [Google Scholar]
- Cabezas, C., Roueff, E., Tercero, B., et al. 2021b, A&A, 650, L15 [NASA ADS] [CrossRef] [EDP Sciences] [Google Scholar]
- Cabezas, C., Fuentetaja, R., Roueff, E., et al. 2022, A&A, 657, L5 [NASA ADS] [CrossRef] [EDP Sciences] [Google Scholar]
- Cabezas, C., Agúndez, M., Pérez, C., et al. 2025, A&A, 701, L8 [NASA ADS] [CrossRef] [EDP Sciences] [Google Scholar]
- Cazzoli, G., Cludi, L., Contento, M., & Puzzarini, C. 2008, J. Mol. Spectrosc., 251, 229 [Google Scholar]
- Ceccarelli, C., Caselli, P., Bockelée-Morvan, D., et al. 2014, Protostars and Planets VI (Tucson: University of Arizona Press), 859 [Google Scholar]
- Cernicharo, J. 2012, EAS Publ. Ser., 58, 251 [Google Scholar]
- Cernicharo, J., Marcelino, N., Agúndez, M., et al. 2020, A&A, 642, L17 [NASA ADS] [CrossRef] [EDP Sciences] [Google Scholar]
- Cernicharo, J., Agúndez, M., Kaiser, R. I., et al. 2021a, A&A, 652, L9 [NASA ADS] [CrossRef] [EDP Sciences] [Google Scholar]
- Cernicharo, J., Cabezas, C., Agúndez, M., et al. 2021b, A&A, 648, L3 [EDP Sciences] [Google Scholar]
- Cernicharo, J., Cabezas, C., Agúndez, M., et al. 2021c, A&A, 647, L3 [EDP Sciences] [Google Scholar]
- Cernicharo, J., Fuentetaja, R., Agúndez, M., et al. 2022, A&A, 663, L9 [NASA ADS] [CrossRef] [EDP Sciences] [Google Scholar]
- Cernicharo, J., Tercero, B., Marcelino, N., et al. 2023, A&A, 674, L4 [NASA ADS] [CrossRef] [EDP Sciences] [Google Scholar]
- Cernicharo, J., Cabezas, C., Fuentetaja, R., et al. 2024a, A&A, 690, L13 [NASA ADS] [CrossRef] [EDP Sciences] [Google Scholar]
- Cernicharo, J., Tercero, B., Cabezas, C., et al. 2024b, A&A, 682, L13 [NASA ADS] [CrossRef] [EDP Sciences] [Google Scholar]
- Dunning, T. H. 1989, J. Chem. Phys., 90, 1007 [Google Scholar]
- Fossé, D., Cernicharo, J., Gerin, M., & Cox, P. 2001, ApJ, 552, 168 [Google Scholar]
- Fuentetaja, R., Cabezas, C., Endo, Y., et al. 2025, A&A, 702, A23 [NASA ADS] [CrossRef] [EDP Sciences] [Google Scholar]
- Heath, G. A., Thomas, L. F., Sherrard, E. I., & Sheridan, J. 1955, Faraday Soc. Disc., 19, 38 [Google Scholar]
- Müller, H. S. P., Schlöder, F., Stutzki, J., & Winnewisser, G. 2005, J. Mol. Struct., 742, 215 [Google Scholar]
- Pickett, H. M., Poynter, R. L., Cohen, E. A., et al. 1998, J. Quant. Spectrosc. Radiat. Transfer, 60, 883 [Google Scholar]
- Purvis, G. D., III, & Bartlett, R. J. 1982, J. Chem. Phys., 76, 1910 [NASA ADS] [CrossRef] [Google Scholar]
- Tercero, F., López-Pérez, J. A., Gallego, J. D., et al. 2021, A&A, 645, A37 [EDP Sciences] [Google Scholar]
- Tercero, B., Marcelino, N., Roueff, E., et al. 2024, A&A, 682, L12 [NASA ADS] [CrossRef] [EDP Sciences] [Google Scholar]
- Timmes, F. X., Woosley, S. E., & Weaver, T. A. 1995, ApJS, 98, 617 [NASA ADS] [CrossRef] [Google Scholar]
- Walmsley, C. M., Jewell, P. R., Snyder, L. E., & Winnewisser, G. 1984, A&A, 134, L11 [NASA ADS] [Google Scholar]
- Wilson, T. L., & Rood, R. 1994, ARA&A, 32, 191 [Google Scholar]
- Yan, Y. T., Henkel, C., Kobayashi, C., et al. 2023, A&A, 670, A98 [NASA ADS] [CrossRef] [EDP Sciences] [Google Scholar]
Appendix A: Line parameters of the CH3C4H isotopologues
Line parameters for all observed transitions with the Yebes 40m radio telescope were derived by fitting a Gaussian line profile to them using the GILDAS package. A velocity range of ±20 km s−1 around each feature was considered for the fit after a polynomial baseline was removed. Negative features produced in the folding of the frequency-switching data were blanked before baseline removal.
Observed line parameters of CH3C4H isotopologues.
All Tables
Molecular constants and column densities derived in this work for the isotopologues of CH3C4H.
Deuteration fractions of methyl-group-containing molecules in TMC-1 compared to gas-phase chemical model results.
Branching ratios for the deuterated version of the C2H + C3H4 reactions, including propyne CH3CCH and 1, 2-propadiene CH2 = C = CH2.
All Figures
|
Fig. 1. Observed lines for the six isotopologues of CH3CCCCH in TMC-1 in the 31.0−50.4 GHz range. Frequencies and line parameters are given in Table A.1. Quantum numbers for the observed transitions are indicated in each panel. The red line shows the synthetic spectrum computed for a rotational temperature of 9 K and the column densities from Table 1. Blank channels correspond to negative features created during the folding of the frequency-switching data. |
| In the text | |
Current usage metrics show cumulative count of Article Views (full-text article views including HTML views, PDF and ePub downloads, according to the available data) and Abstracts Views on Vision4Press platform.
Data correspond to usage on the plateform after 2015. The current usage metrics is available 48-96 hours after online publication and is updated daily on week days.
Initial download of the metrics may take a while.