| Issue |
A&A
Volume 703, November 2025
|
|
|---|---|---|
| Article Number | C2 | |
| Number of page(s) | 6 | |
| Section | Stellar structure and evolution | |
| DOI | https://doi.org/10.1051/0004-6361/202557782e | |
| Published online | 07 November 2025 | |
Tidal dissipation in evolved low- and intermediate-mass stars (Corrigendum)
1
Instituut voor Sterrenkunde, KU Leuven, Celestijnenlaan 200D, 3001 Leuven, Belgium
2
Université Paris-Saclay, Université Paris Cité, CEA, CNRS, AIM, 91191 Gif-sur-Yvette, France
⋆ Corresponding author: This email address is being protected from spambots. You need JavaScript enabled to view it.
Key words: errata, addenda / methods: numerical / planet-star interactions / binaries: close / stars: evolution / planetary systems
We discovered that we used an inconsistent definition for the critical period Pc in Sect. 4.1 of the original paper (Esseldeurs et al. 2024). Here we used the definition Pc = 1/νc, while the correct definition is Pc = 2 ⋅ 2π/νc, where νc is the critical frequency defined in Eq. (6) of Esseldeurs et al. (2024). The 2π factor originates from a misinterpretation of the unit of νc. Footnote 3 of Esseldeurs et al. (2024) are therefore incorrect, and Ahuir et al. (2021) is correct. The additional factor of 2 arises from the definition of the tidal frequency ωt = nΩo − mΩs, where the critical period corresponds to the orbital period of a companion in a coplanar circular orbit (with m = n = 2) that generates waves at the critical frequency.
The main results of Esseldeurs et al. (2024) remain unaffected by this correction; only the range of applicability of the results is slightly modified during the main-sequence (MS) phase. Fig. 4 of Esseldeurs et al. (2024) has been updated to reflect this correction and is shown in Fig. 1. In Sect. 4.1 of Esseldeurs et al. (2024), the second paragraph should be updated to:
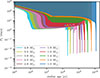 |
Fig. 1. Critical period, Pc = 4π/νc, for different stellar masses. The different colours represent the same model as in Fig. 4 of Esseldeurs et al. (2024). The filled regions indicate where the g-waves are excited as progressive IGWs. |
The critical period also depends on the initial mass of the star. For lower-mass stars (e.g. the 1 M⊙ model), the critical period is approximately 40 days during the MS, while for higher-mass stars (e.g. the 4 M⊙ model), the critical period is approximately 1 day during the MS. Therefore, it is possible for short-period companions (with periods of the order of 1 day) around the lower-mass stars (below or equal to 1.2 M⊙) in the MS to excite g-modes in the radiative layer instead of progressive IGWs. The tidal dissipation of these g-modes is likely to be more effective than the tidal dissipation estimated in this study, since standing modes might experience enhanced dissipation efficiency, potentially amplified through resonance locking (e.g. Witte & Savonije 2002; Fuller 2017).
Furthermore, Figs. 9–13 and D1–D6 of the original paper have been updated to reflect this correction and are shown in Figs. 2–11. The conclusions of the paper remain unchanged.
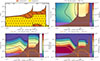 |
Fig. 2. Internal structure and tidal dissipation evolution for a MZAMS = 1 M⊙ star. Top left: Kippenhahn diagram. The hatched brown regions represent convective layers, and the dotted yellow region represents radiative layers. Stellar evolutionary phases (PMS to WD) are indicated. Top right, bottom left, and bottom right: Complex part of the Love number for the equilibrium tide (Im(k22)eq), the dynamical tide (Im(k22)IGW), and the ratio of the dissipations of the dynamical tide to the dissipation of the equilibrium tide (Im(k22)IGW/Im(k22)eq), respectively, as a function of stellar age and orbital period. The Roche limit is shown in purple, the critical period (4π/νc; see Eq. 6 of Esseldeurs et al. 2024) in orange, and the period at which a planet orbits at the stellar radius in brown. Changes in the stellar evolutionary phase are indicated with ticks in the upper axis. |
Acknowledgments
We would like to thank Jim Fuller for pointing out the inconsistency in the definition of the critical period.
References
- Ahuir, J., Mathis, S., & Amard, L. 2021, A&A, 651, A3 [NASA ADS] [CrossRef] [EDP Sciences] [Google Scholar]
- Esseldeurs, M., Mathis, S., & Decin, L. 2024, A&A, 690, A266 [NASA ADS] [CrossRef] [EDP Sciences] [Google Scholar]
- Fuller, J. 2017, MNRAS, 472, 1538 [Google Scholar]
- Witte, M. G., & Savonije, G. J. 2002, A&A, 386, 222 [NASA ADS] [CrossRef] [EDP Sciences] [Google Scholar]
© The Authors 2025
 Open Access article, published by EDP Sciences, under the terms of the Creative Commons Attribution License (https://creativecommons.org/licenses/by/4.0), which permits unrestricted use, distribution, and reproduction in any medium, provided the original work is properly cited.
This article is published in open access under the Subscribe to Open model. This email address is being protected from spambots. You need JavaScript enabled to view it. to support open access publication.
All Figures
|
Fig. 1. Critical period, Pc = 4π/νc, for different stellar masses. The different colours represent the same model as in Fig. 4 of Esseldeurs et al. (2024). The filled regions indicate where the g-waves are excited as progressive IGWs. |
| In the text | |
|
Fig. 2. Internal structure and tidal dissipation evolution for a MZAMS = 1 M⊙ star. Top left: Kippenhahn diagram. The hatched brown regions represent convective layers, and the dotted yellow region represents radiative layers. Stellar evolutionary phases (PMS to WD) are indicated. Top right, bottom left, and bottom right: Complex part of the Love number for the equilibrium tide (Im(k22)eq), the dynamical tide (Im(k22)IGW), and the ratio of the dissipations of the dynamical tide to the dissipation of the equilibrium tide (Im(k22)IGW/Im(k22)eq), respectively, as a function of stellar age and orbital period. The Roche limit is shown in purple, the critical period (4π/νc; see Eq. 6 of Esseldeurs et al. 2024) in orange, and the period at which a planet orbits at the stellar radius in brown. Changes in the stellar evolutionary phase are indicated with ticks in the upper axis. |
| In the text | |
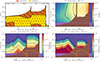 |
Fig. 3. Same as Fig. 2, but for a MZAMS = 1.2 M⊙ star. |
| In the text | |
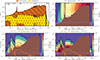 |
Fig. 4. Same as Fig. 2, but for a MZAMS = 1.4 M⊙ star. |
| In the text | |
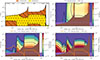 |
Fig. 5. Same as Fig. 2, but for a MZAMS = 1.6 M⊙ star. |
| In the text | |
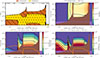 |
Fig. 6. Same as Fig. 2, but for a MZAMS = 1.8 M⊙ star. |
| In the text | |
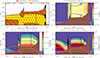 |
Fig. 7. Same as Fig. 2, but for a MZAMS = 2 M⊙ star. |
| In the text | |
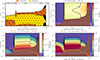 |
Fig. 8. Same as Fig. 2, but for a MZAMS = 2.5 M⊙ star. |
| In the text | |
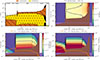 |
Fig. 9. Same as Fig. 2, but for a MZAMS = 3 M⊙ star. |
| In the text | |
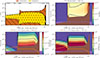 |
Fig. 10. Same as Fig. 2, but for a MZAMS = 3.5 M⊙ star. |
| In the text | |
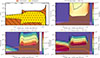 |
Fig. 11. Same as Fig. 2, but for a MZAMS = 4 M⊙ star. |
| In the text | |
Current usage metrics show cumulative count of Article Views (full-text article views including HTML views, PDF and ePub downloads, according to the available data) and Abstracts Views on Vision4Press platform.
Data correspond to usage on the plateform after 2015. The current usage metrics is available 48-96 hours after online publication and is updated daily on week days.
Initial download of the metrics may take a while.