| Issue |
A&A
Volume 704, December 2025
|
|
|---|---|---|
| Article Number | A207 | |
| Number of page(s) | 10 | |
| Section | Planets, planetary systems, and small bodies | |
| DOI | https://doi.org/10.1051/0004-6361/202452971 | |
| Published online | 16 December 2025 | |
Dust back reaction on gas around planets modifies the cold thermal torque
1
Charles University, Faculty of Mathematics and Physics, Astronomical Institute,
V Holešovičkách 747/2,
180 00
Prague 8,
Czech Republic
2
Instituto de Astronomía, Universidad Nacional Autónoma de México,
Apt. Postal 70-264,
C.P. 04510,
Mexico City,
Mexico
3
Instituto de Astronomía, Universidad Nacional Autónoma de México,
Ensenada,
B.C.
22800,
Mexico
4
IRAP, Université de Toulouse, CNRS, UPS,
31400
Toulouse,
France
5
Max-Planck-Institut für Sonnensystemforschung,
Justus-von-Liebig-Weg 3,
Göttingen
37077,
Germany
6
Division of Space Research & Planetary Sciences, Physics Institute, University of Bern,
Sidlerstr. 5,
3012
Bern,
Switzerland
7
Max-Planck-Institut für Astronomie,
Königstuhl 17,
69117
Heidelberg,
Germany
8
Fakultät für Physik, Universität Duisburg-Essen,
Lotharstraße 1,
47057
Duisburg,
Germany
9
Jet Propulsion Laboratory, California Institute of Technology,
Pasadena,
CA
91109,
USA
★ Corresponding author: This email address is being protected from spambots. You need JavaScript enabled to view it.
Received:
12
November
2024
Accepted:
3
November
2025
Abstract
Context. A nascent planet in a gas disk experiences radial migration due to the different torques that act on it (e.g., Lindblad and corotation torques). It has recently been shown that the torques produced by the gas and dust density variations around a non-accreting low-mass planet, the so-called cold thermal and dust streaming torques, can surpass each of the other torque components.
Aims. We investigate how the total torque acting on the planet is affected by the presence of dust grains and their aerodynamic back reaction on gas, while taking into account the cold thermal torque produced by thermal diffusion in the gas component.
Methods. We performed high-resolution local and global three-dimensional two-fluid simulations within the pressureless-fluid dust approximation using the Fargo3D code. We explored the influence of different dust species parameterized by the Stokes number, focusing on non-accreting protoplanets with masses from one-third the mass of Mars to one Earth mass.
Results. The dust feedback has a substantial impact on the asymmetry of the cold thermal lobes (which produce the cold thermal torque). However, the total torque is dominated by the dust torque when St > 10−2. The dust torque becomes more negative over time due to the formation of dust lobes that resemble the cold thermal lobes that form in the gas component. Therefore, the dust streaming torque prevails over the cold thermal torque. On the other hand, when St = 10−2, the dust streaming torque is negligible and thus, the total torque on the planet comes from the gaseous component of the disk.
Conclusions. Our results suggest that a planet embedded in a gas-dust disk may experience stagnant migration or inward runaway migration in regions of the protoplanetary disk where the dust is not fully coupled to the gas. However, this behavior could change in regions with strong dust-gas coupling or in the inner transition region of the disk, where the cold thermal torque may become relevant.
Key words: hydrodynamics / planets and satellites: formation / protoplanetary disks / planet-disk interactions
© The Authors 2025
 Open Access article, published by EDP Sciences, under the terms of the Creative Commons Attribution License (https://creativecommons.org/licenses/by/4.0), which permits unrestricted use, distribution, and reproduction in any medium, provided the original work is properly cited.
This article is published in open access under the Subscribe to Open model. This email address is being protected from spambots. You need JavaScript enabled to view it. to support open access publication.
1 Introduction
Planets are formed in disks of gas and dust and, as their mass grows, they interact gravitationally with the disk. The exchange of angular momentum between the planet and the disk due to the gravitational interaction substantially changes the planet's semimajor axis, which is known as the process of planetary migration (see Paardekooper et al. 2023 for a review). For isothermal disks with simple power-law profiles, the disk's torque leads to a decrease in the planet's orbital radius. A long outstanding problem is that low-mass planets would fall toward the central star in a timescale much shorter than the lifetime of the disk (Ward 1986; Tanaka et al. 2002). In the last two decades, different mechanisms have been proposed to solve this problem. They include non-isothermal disks, disks with a magnetic field, vortex-planet interactions, density traps, energy transfer within a disk that gives rise to “thermal torques” (defined hereafter), dust torques (which arise from the asymmetric distribution of dust around the planet), among others (see Lesur et al. 2022; Paardekooper et al. 2023, for a review).
Recent work has shown that thermal diffusion in gaseous disks can play a decisive role in determining the direction of migration (Lega et al. 2014; Benítez-Llambay et al. 2015; Masset 2017) and that the total torque can differ greatly from that in isothermal or adiabatic disks (Jiménez & Masset 2017; Chametla & Masset 2021). In the case of a nonluminous planet embedded in a gaseous disk with thermal diffusion, the torque difference with respect to the adiabatic case is called the cold thermal torque. This torque arises from the gas in the vicinity of the planet, which becomes colder and denser as the energy generated by compressional heating diffuses away from the planet. The distribution of cold gas around the planet develops a shape of two symmetric lobes if the disk is strictly Keplerian. When the planet is offset from the planet-gas corotation, as occurs when there is a radial pressure gradient, the lobes are not symmetric with respect to the planet. The lobe located on the same side of corotation as the planet is more pronounced, resulting in a net torque on the planet with the same sign as the torque from this lobe (Masset 2017). Lega et al. (2014) showed that in the usual case in which the disk is slightly sub-Keplerian and the planet is outside of its corotation, the cold thermal torque is negative, that is, the migration is inward. The effect of thermal diffusion on the gas density distribution around a low-mass planet was first reported in Lega et al. (2014). Using 3D radiative hydrodynamical simulations, they found two cold regions of a high density in the co-orbital region near the planet. These regions, which were named “cold fingers” by the authors, are the result of a larger entropy loss in gas parcels that experience more compressional heating.
Later on, Masset (2017) showed that these structures in density are mainly due to the fact that thermal diffusion flattens the temperature peak that is located at the planet position. Additionally, he suggested that the denomination “cold lobes” is more adequate in the presence of thermal diffusion and showed that 3D calculations are required to correctly capture the respective cold thermal torque.
On the other hand, given the low mass of dust in protoplane-tary disks (the dust-to-gas ratio is considered to be around 0.01), the gravitational torque exerted by the dust on the planet is typically neglected. However, Benítez-Llambay & Pessah (2018), using a 2D isothermal gas-dust model without feedback of the dust on the gas, found that the dust in the vicinity of the planet can generate a positive total torque depending on the dust drift speed, the dust-to-gas mass ratio and possibly distribution, and the embryo mass (see also Regály 2020; Chrenko et al. 2024).
Previous studies that included thermal diffusion did not consider the contribution of dust to the total torque. In this paper, we incorporate both thermal diffusion and the dust back reaction on the gas (hereafter named “feedback”) to investigate whether the cold, dense lobes are redistributed differently depending on the degree of dust-gas coupling, and how this affects the total torque acting on the planet.
The paper is organized as follows. In Section 2, we present the physical model. In Section 3, the numerical setup used in our high-resolution 3D simulations is described. We show the main effects of the dust feedback on the cold thermal torque and on the resulting total torque in Section 4. In Section 5, we discuss the main implications of the behavior of the total torque on the migration of a low-mass planet. Concluding remarks can be found in Section 6.
2 Physical model
In this section, we describe the different components of our physical model and provide a brief description of 3D gaseous-dusty disks employed in this study.
2.1 Gas disk governing equations
We consider a 3D, non-self-gravitating gas disk component whose evolution is governed by the following equations:
 (1)
(1)
 (2)
(2)
 (3)
(3)
where ρg and v denote the gas density and the gas velocity, respectively. In Eq. (3), FH is the heat flux, given as
 (4)
(4)
where eg is the gas thermal energy density and χ the thermal diffusivity. Furthermore, Φ denotes the gravitational potential, I is the unit tensor, fd is the drag force between the gas and dust (Eq. (9)), and p is the gas pressure. For the latter, we write the caloric equation of state as
 (5)
(5)
and use γeff = 7/5, the value for a perfect diatomic gas. This applies approximately to a solar-abundance H2+He gas above T ≈ 300 K (Bitsch et al. 2013) and below T ≈ 1000-2000 K, as one can verify easily for instance using the Vaidya et al. (2015) implementation of the classical equation of state formulæ of D'Angelo & Bodenheimer (2013). (The latter use Y, an uppercase Upsilon, instead of γeff.) In this low-temperature regime, the first adiabatic exponent Γ1 (not to be confused with a torque) is also approximately equal to 7/5. It will be used in Equation (10) below. Afterwards, we subsequently denote both indistinctly by γ but for a more general (even ideal but not constant) equation of state, they would need to be distinguished.
In our global 3D disk models, the gas turbulence is included in Eq. (2) via the viscous stress tensor:
![Mathematical equation: \mathbf{\tau}=\rho_\mathrm{g}\nu\left[\nabla\mathbf{v}+(\nabla\mathbf{v})^{\mathrm{T}}-\frac{2}{3}(\nabla\cdot\mathbf{v})\mathsf{I}\right],](/articles/aa/full_html/2025/12/aa52971-24/aa52971-24-eq6.png) (6)
(6)
where ν is the gas kinematic viscosity parametrized as in α description (see Shakura & Sunyaev 1973).
We stress that gas viscosity has an important implicit effect on dust dynamics, since through it, dust itself feels turbulence.
Lastly, we mention that our local models do not include the gas turbulence, i.e., we use an inviscid disk model.
2.2 The governing equations for the dust
The equations of dust dynamics in the pressureless fluid approximation (Weber et al. 2018) are given as
 (7)
(7)
 (8)
(8)
Here ρd and u are the dust density and dust velocity, respectively. In Equations (2) and (8), the last term on the right-hand side is the drag force term given as
 (9)
(9)
where St is the Stokes number, which measures the dust-gas coupling and relates to the dust grain properties via
 (10)
(10)
where a is the grain size,  is the sound speed (squared), with Γ1 the adiabatic index, and ρ• the material density of the dust.
2.3 Turbulent dust diffusion model
Since gas turbulence has been included in global simulations, its effect on the dust component must also be considered. Therefore, we incorporate this effect into Eq. (7) through the vector jd (Morfill & Voelk 1984):
 (11)
(11)
where Dd is the dust diffusion coefficient, which is linked to gas turbulence through the Schmidt number
 (12)
(12)
which quantifies the relative effectiveness of the gas angular momentum transport and the dust-mixing processes. It is common to assume that the dust diffusion turbulent coefficient δ ≡ Dd/(csHg), with Hg is the pressure scale height of the gas in the disk, defined as Hg = cs/Ωκep (here ΩKep the Keplerian angular frequency), is on the order of the α viscosity parameter. Nevertheless, we are aware that α does not need to be the same as δ (Krapp et al. 2024). Since the difference arises from that while α is set by ionized gas dynamics in hot gas regions or by hydrodynamical instabilities such as vertical shear instability (VSI; Lesur et al. 2025; Ogilvie et al. 2025) or spiral wave perturbations (Chametla et al. 2024) in cold gas regions (which applies here), δ is controlled by gas-dust interactions and the size of turbulent eddy (see Zhu et al. 2015). Furthermore, the turbulent alpha coefficient in the gas is always larger than the turbulent diffusion coefficient of the dust (see for instance Hasegawa et al. 2017, and references therein).
Note that here, we have followed a similar approach that of Chametla et al. (2025) where ν = Dd (here the diffusion coefficients are constant). Our motivation for this choice is based on the fact that in a turbulent disk (α ≃ 10−3) dust asymmetries around of Earth-like planet are not formed. This allows us to isolate the effect of dust feedback on the cold lobes and vice versa.
In the low-turbulence approximation (α = 10−5), the dust hole can form in the vicinity of the planet (see Appendix A) which is in agreement with what was reported in Chametla et al. (2025).
2.4 Gravitational potential
The gravitational potential Φ is given by
 (13)
(13)
where the stellar and planetary potentials are respectively
 (14)
(14)
 (15)
(15)
In Eq. (15), r′ = |r − rp| is the cell-planet distance, φ is the azimuth with respect to the planet, θ is the colatitude, and rsm is a softening length used to avoid computational divergence of the potential in the vicinity of the planet. The second term on the right-hand side of Eq. (15) is the so-called “indirect term” arising from the reflex motion of the star (Murray & Dermott 1999; Müller et al. 2012; Crida et al. 2022).
For the smoothing length, we explored two cases: rsm = 0.005Hg and rsm = 0.01 Hg. Note that the smoothing length is a numerical parameter and that its value has been chosen to be sufficiently small, on the order of a grid cell, to minimize its impact on the global solution (see Appendix B).
3 Setup
We consider a 3D gaseous-dusty disk corotating with the planet and use a polar spherical grid (r, θ, φ) centered on the star. Here, r is the radial distance from the star, θ is the polar angle and φ is the azimuthal angle. The volumetric gas disk density is given by (Masset & Benítez-Llambay 2016):
 (16)
(16)
with
 (17)
(17)
where Σ0 is the surface density at r = rp and hg the gas disk aspect ratio.
For the dust disk component, we consider an initial dust density profile that depends on the dust pressure scale hd, such that
 (18)
(18)
and
 (19)
(19)
In Eq. (19), the initial dust-to-gas mass ratio ε is such that Σd/Σg = 0.01.
We initialize the gas velocity components as follows: vr = vθ = 0 and1
 (20)
(20)
The radial and vertical components of the dust velocity are both zero initially, whereas the azimuthal component starts with the gas azimuthal rotation profile. We performed our simulations in pairs, that is, including only the gas, or the gas and a single dust species.
3.1 Relevant scales in cold thermal torque: size of thermal lobes
Masset (2017) found that thermal disturbances in the vicinity of a low-mass planet can be described by an advection-diffusion equation. Even more so, the size of the thermal disturbance can be given as
 (21)
(21)
where Ωp the planet’s orbital angular frequency. The degree of symmetry of the disturbance depends on the offset xp of the planet with respect to the corotation radius, defined as
 (22)
(22)
Here, η = σ/3 + (β + 3)/6, with σ ≡ -d ln Σ/d ln r and β ≡ -d ln T/d ln r.
3.2 Local inviscid disk models
We subsequently analyze the effect of dust feedback on the gas and the resulting modification of the cold thermal torque, applying it to the same model previously studied by Chametla & Masset (2021), who did not account for dust in their analysis. The model consists of a low-mass planet with Mp = 0.03 M⊕, embedded in an inviscid disk (ν = 0) with parameters (σ,β) = (0,0), and χ = 10−5 r2pΩp. In this model xp/λc ≈ 0.57, representing a case where there is good agreement between linear theory and cold thermal torque simulations.
We include the dust component and consider four values of the Stokes number in the range [P.8 × 10−5,0.P8]. The dust density was initialized as ρd = ερg, implying that hd = hg (see Eqs. (17)-(19)). At t = 0, we set ε = 0.01.
To enable a faithful comparison within the linear regime, we perform local simulations specifically designed to resolve the thermal disturbance λc with sufficient accuracy. In particular, resolving λc with approximately ten grid cells is necessary to properly capture the strength of the cold thermal torque. In the local simulations, the computational mesh extends from 0.9rp to 1.1 rp in the radial direction, from -π/18 to π/18 in the azimuthal direction, and between π/P - hp and π/P in colatitude. Here hp is the gas aspect ratio at the position of the planet.
3.3 Global viscous disk models
In the global models, we adopt disk parameters similar to those used in Eklund & Masset (2017) and Velasco Romero et al. (2022). Specifically, we use (β,ξ) = (1,1.5), yielding a powerlaw index for the surface density of σ = 0.5, a surface gas density Σ0 = 6.05 × 10⁻⁴ at rp (about P00 g cm−p for a solar-like central star), a constant aspect ratio hg = 0.05, and a thermal diffusivity of χ = 4.5 × 10⁻⁵ r2pΩp2. We also include a constant kinematic viscosity ν = 10−5 r2pΩp, corresponding to the value of α = P.5 × 10−3. The mass of the planet takes the values Mp = 0.3M⊕ and 1.0M⊕.
For the dust component, we consider three different Stokes numbers St = {10−3,0.01,0.1}. Even in a viscous disk, dust settles toward a scale height which tends to be lower than that of gas (hd ≠ hg). To initialize the dust density, we use Eq. (18) with
 (23)
(23)
which describes the equilibrium between dust settling and turbulent diffusion (see Dubrulle et al. 1995). We set δ = 10−3 for all Stokes number values.
Because the planet’s mass is larger in this case, our models fall outside the linear regime (see below). Therefore, to adequately capture both thermal perturbations in the gas and the dust density structures, we perform global numerical simulations. Our computational domain extends for 0.48rp to 2.08rp in the radial direction, from -π to π in the azimuthal direction, and between π/P - Php to π/P in colatitude. The number of zones in each direction is (Nr, Nφ, N⊙) = (1864,1864,1P8). Once the domain of the computational box and the number of zones have been set, to increase the resolution around the planet, we use mesh density functions in both the radial and azimuthal directions3 (see Benítez-Llambay et al. 2023), resulting in ∆r = ∆φ = 5 × 10⁻⁴. The computational domain entirely contains the gas and dust structures formed in the vicinity of the planet. Since we do not know a priori the effect of feedback on the gas structures in the vertical direction, we prefer to maintain a uniform mesh with a resolution similar to that used in Chametla & Masset (2021). Note that the dust height scale is not sensitive to the change in vertical resolution (see Appendix A in Chametla et al. 2025).
3.4 Code and boundary conditions
To solve numerically the continuity, momentum and gas-energy equations for the gas and dust, we use the hydrodynamic multi-fluid code FARGO3D4 (Benítez-Llambay & Masset 2016; Benítez-Llambay et al. 2019) with the fast orbital advection algorithm of Masset (2000) and the rapid advection method (RAM; Benítez-Llambay et al. 2023). A thermal diffusion module was implemented and tested in Chametla & Masset (2021) for a numerical study of thermal torques in dust-free disks. The RAM version of FARGO3D code allows us to increase the resolution sufficiently in the vicinity of the planet to capture the effects of thermal diffusion in the gas on a global grid of the protoplanetary disk.
We implemented boundary conditions for each dust species similar to those implemented for the density and velocity components of the gas (for details, see Chametla & Masset 2021). In the radial direction, we use wave-damping boundary zones as in de Val-Borro et al. (2006); the width of the inner and outer damping rings is at ri = 0.915rp, ro = 1.015rp, ri = 0.65rp and ro = 1.65rp for the local and global models, respectively. The damping time-scale at the edge of each ring in both models is 0.3Tloc, with Tloc the local orbital period. At the upper meridional boundaries (θmin), we apply an extrapolation of the initial profiles for the gas and dust densities, along with antisymmetric boundary conditions for vθ and uθ, respectively. At the lower meridional boundaries (θmax), we use reflecting boundary conditions, since all our models include only one hemisphere of the disk.
4 Results
4.1 Cold thermal torque within linear regime in gaseous-dusty disks
In order to properly model dust settling, or the lack thereof, we start our local models with the dust scale height being equal to the gas scale height, that is, assuming that dust grains are initially well mixed with the gas.
4.1.1 Cold thermal torque in a purely gaseous disk
The cold thermal torque can be estimated in linear theory if xp ≲ λc ≪ Hg and the planetary mass is smaller than the critical mass defined as:
 (24)
where Mth ≡ c3s/(GΩp) is the thermal mass (see Sect. 6.1 in Chametla & Masset 2021). If these conditions are fulfilled, the cold thermal torque is given by
(24)
where Mth ≡ c3s/(GΩp) is the thermal mass (see Sect. 6.1 in Chametla & Masset 2021). If these conditions are fulfilled, the cold thermal torque is given by
 (25)
(25)
(Masset 2017) We express  as a multiple of
 (26)
(26)
instead of the usual expression that scales as hg−2 (see Masset 2017). Equation (25) provides the torque in the absence of dust and will be used as a reference value to compare when we include the dust back reaction.
From Table 1 and the parameters introduced in Section 2, only the simulation with a planet of mass Mp = 0.03M⊕ (model Mp0.03LR) satisfies the conditions for the linear regime. Then, if we substitute the values of xp and λc in Eq. (25), the cold thermal torque is  in this case.
To compare the predicted cold thermal torque with simulation results, we ran a simulation of a low-mass planet embedded in a purely gaseous disk (that is, Mp0.03LR model for a Stokes number of St = 0, see Table 1). The evolution of the total gas torque is shown in Fig. 1. The value predicted by Eq. (25) agrees with the simulation result to within 2.8%. This indicates that our numerical approximation adequately captures the effect of the cold thermal torque. Figure 1 can be directly compared with Fig. 5 of Chametla & Masset (2021), as the case presented there for a low-mass planet with luminosity L = 0 is equivalent to our Mp0.03LR model with St = 0.
4.1.2 Cold thermal torque in the presence of dust feedback
Having determined the value of the cold thermal torque for a low-mass planet embedded in a gas disk without dust, we now investigate how this torque is affected when dust feedback on the gas is included. To this end, we have included dust in the Mp0.03LR model with a Stokes number St ∈ [0,0.28]. The results of these numerical experiments are shown in Fig. 1.
We find that, for St = 2.8 × 10⁻⁵, the dust is strongly coupled to the gas and hence the gas torque does not change with respect to the simulation without any dust species (in Fig. 1 case with St = 0.0). For dust with St = 2.8 × 10⁻³, the cold thermal torque is less negative than the gas torque in the model with St = 0.0 (about 15% less). The angular momentum transfer by the dust to the gas is more significant when St = 2.8 × 10⁻²; the torque presents a greater offset (∼25%). Finally, when St = 0.28, the cold thermal torque changes considerably. It is about 60% lower than the value obtained in the case without feedback (cases St = 0 and St = 2.8 × 10⁻⁵). Notably, for St = 0.28 and without dust feedback, the torque also converges to the value given by Eq. (25).
Some authors have investigated how torques are affected when the planet releases heat (e.g., Chametla & Masset 2021). It is instructive to compare the torque resulting from dust feedback with that arising from heat release. By comparing with Figure 5 in Chametla & Masset (2021), we find that a non-accreting planet subject to the dust back-reaction experiences a torque similar to that of a planet with the same mass and a luminosity close to the critical luminosity Lc.
Summary of our numerical models.
4.2 Beyond of the linear regime
The results obtained in the previous section suggest that the effect of dust feedback on gas can be important on a low-mass planet, even without accreting pebbles. To investigate the effects of a more massive planet, we make use of the global disk models described in Section 3.3. Since we are interested in analyzing the effect of different dust species on the total torque on the planet, we subsequently describe the results in terms of the Stokes number.
Fig. 2 shows the temporal evolution of the total torque and the gas torque in models Mp0.3AD, Mp0.3TD, Mp1.oAd and Mp1.0TD with St = 0.001. We find that, for the TD models, the total torque is more negative than for the AD models. We recall that in both the AD and TD models, we also included dust and its back-reaction force on the gas. Although the dust-to-gas ratio increases, then the dust feedback effect also increases, from Fig. 2, it is clear that the gas torque dominates in models with thermal diffusion, i.e. the cold thermal torque.
Fig. 3 shows the total torque and the gas torque on a planet with Mp = 0.3, for St = 0.1. While the gas torque remains approximately steady, the dust torque becomes increasingly negative. Within the first twenty orbital periods, the dust torque surpasses the gas torque in magnitude by a factor of two.
For a planet with Mp = 1.0 M⊕ and St = 0.1, the torque is again dominated by the dust component, which exhibits a decreasing oscillatory pattern (see Fig. 4). It should be mentioned that the difference in total torque between AD and TD models is significantly reduced as a result of the decreased coupling of the dust to the gas.
Particular attention should be paid to the case of a Stokes number of St = 0.01 in an adiabatic disk (see Fig. 5), since the gas torque can become positive. However, at the same time, the dust torque contributes just enough to such an extent that it counteracts the gas component, resulting in zero torque on the planet. For the Mp1.0TD model with St = 0.01, a similar behavior is observed, with the cold thermal torque prevailing over the dust torque. Lastly, we stress that the torque values presented have converged with respect to the numerical resolution (see Chametla et al. 2025).
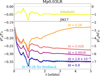 |
Fig. 1 Normalized gas torque as a function of time in the linear case (xp/λc ≈ 0.57) for different values of St. The horizontal dotted line shows the torque value expected in the adiabatic disk according to Jiménez & Masset (2017) which we have included as a reference value. The right vertical axis corresponds to the usual normalization of the torque. |
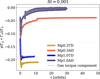 |
Fig. 2 Normalized total torque (gas plus dust) as a function of time in the settling regime for global models (see Table 1) when St = 10−3. Althoughxp/λc ≈ 0.45 for all simulations, the smallest mass of the planets considered here is equal to the critical mass Mc (see Eq. (13)), so these models can be classified beyond the linear theory. The dashed gray lines overlapped on the curves represent the torque value of the gas component. For all planet masses, the gas component dominates the total torque. |
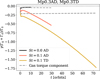 |
Fig. 3 Normalized total torque (gas plus dust) as a function of time in the settling regime, for the global models Mp0.3AD and Mp0.3TD (see Table 1) considering that St = {0.0,0.1}. The total torque is dominated by the dust torque. |
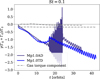 |
Fig. 4 Similar to Fig. 3 but for a planetary mass of Mp = 1.0 M⊕ and St = 0.1. It can clearly be seen that the total torque is dominated by the dust torque component. |
5 Discussion
5.1 Dust feedback freezes cold thermal torque
As we showed in the previous section, it is clear that there is a bifurcation in the total torque value depending on the Stokes number. Here, let us first discuss the behavior of the gas component torque, which includes the cold thermal torque and the adiabatic case.
Remarkably, the value of the cold thermal torque appears to be insensitive to the Stokes number for a given value of the planet’s mass. In other words, for both a planet with a mass of Mp = 0.3 M⊕ and a planet with a mass three times greater (Mp = 1 M⊕), and for all Stokes numbers explored, the value of the gas torque remains around −0.2γ−1Γ0 (see Figs. 2-5).
This can be explained as follows. Thermal diffusivity produces perturbations of temperature and density of opposite signs without drastically changing the pressure (Masset 2017). For small Stokes numbers (St ≤ 10−2), dust tends to accumulate very close to the planet as a result of the greater coupling to the gas. For Stokes numbers larger than 10−2, the coupling decreases and the gas maintains its structure generated by the diffusionadvection mechanism. Therefore, in both regimes the effects of turbulent diffusion and the dust feedback produce a counterweight to give rise to cold thermal lobes with an asymmetry to generate such a value of the torque.
Fig. 6 shows the general structure of the planetary wakes and the thermal lobes for the Mp0.3TD model with St = 0.1. The asymmetric overdensity around the planet (right panel in Fig. 6) produces the cold thermal torque. Note that there is a filament emerging behind the planet position (X, Y) = (1,0), this is an effect of the subtraction of the adiabatic simulation. In other words, it is a low-density region that only appears in the simulation without thermal diffusivity. Therefore, the shape of the cold thermal lobes is well defined as can be inferred from the behavior of the gas torque since no strong oscillations or peaks are observed once the steady state is reached.
In the case of the adiabatic torque, its dependence on the Stokes number is significant; for St = 0.01, the torque can be positive and, in fact, reaches its maximum value compared to other Stokes numbers. As the Stokes number increases beyond this point, the torque decreases and eventually becomes negative.
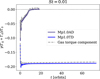 |
Fig. 5 Same as Fig. 4 but for St = 0.01. In this case, we see that the total torque is dominated by the gas torque component. |
5.2 Dust streaming torque
Recent 2D isothermal disk models neglecting dust feedback and dust turbulent diffusion (Benítez-Llambay & Pessah 2018; Regály 2020) show that asymmetric dusty structures can be formed behind (underdense dust hole structure) or in front (over-dense filamentary structure) of the planet. In many cases, the torque generated by such structures is a positive quantity which can exceed in magnitude the gas torque (see also Chrenko et al. 2024). Furthermore, these types of dust structures have been studied using the linear theory approach (including turbulent diffusion) in 2D protoplanetary disks (Hou & Yu 2024, 2025).
Chametla et al. (2025) showed that the dust density structures around a planet in an isothermal disk can evolve very differently over time compared to those in 2D models when dust feedback and turbulent diffusion are taken into account. Furthermore, the 3D simulations presented in Chametla et al. (2025) demonstrate that the overdense filament in front of the planet transforms into a trench, and that the dust hole (or void) can become deformed, potentially leading to either oscillatory or runaway migration depending on the strength of the feedback.
We emphasize that the models presented here represent both thermodynamic generalization, through the inclusion of adiabatic and thermally diffusive disk conditions, and an extension to a lower planetary mass regime (Mp < 1.5 M⊕) compared to the study by Chametla et al. (2025). This broader framework is particularly important, because decreasing the planet’s mass and changing the gas thermodynamics reveals significant differences from those reported in that paper and in previous 2D studies. More specifically:
- (i)
In all global models where perturbations in dust density are correctly captured, regardless of whether they are adiabatic or with thermal diffusivity, and regardless of the value of the Stokes number, we find a negative dust torque.
- (ii)
When the dust torque dominates (that is, for St > 10−2), we find the formation of high-density dust lobes around the planet (see Fig. 7), which are reminiscent of the cold thermal lobes formed in the gas (henceforth called dust lobes). These dust lobes produce a dust torque that becomes increasingly negative over time, leading to an inward runaway migration.
The left panel of Fig. 7 displays the dust density in the midplane of the disk near a planet of mass Mp = 1.0 Mθ for St = 0.01 (i.e. for model Mp1.0TD) at t = 40 orbits. It is clearly seen that neither a dust void nor a trench forms in the planet’s vicinity. Instead, a very small, quasi-symmetric dust lobe forms, which does not produce a torque exceeding that of the gas. Moreover, in both disk models (either adiabatic or those including thermal diffusivity), we do not observe the formation of a dust void behind the planet or a trench in front of it. This is consistent with Chametla et al. (2025) who report that large-scale dust structures (Benítez-Llambay & Pessah 2018) are erased if the turbulent dust diffusion is sufficiently strong (note that our global scale simulations use a relatively large kinematic viscosity (Sec 3.3) and compare to Appendix A).
5.3 Further improvements in total torque measurement in gaseous-dusty disk models
For the first time, we have analyzed here the effect of cold thermal torque and dust streaming torque on a planet in global disk models. Although this study represents a step beyond what has been done so far in three-dimensional disk models that include two fluids (gas and dust) and a more realistic thermodynamic treatment than an isothermal disk, some outstanding questions need to be addressed. Specifically, how does the torque change if the planet releases heat (as a consequence of dust accretion)? That is, the counterpart of cold thermal torque, such as heating torque (see Benítez-Llambay et al. 2015; Masset 2017; Chametla & Masset 2021). Also, what is the effect of including a dust size distribution instead of a constant Stokes number in the torque bifurcation reported here? Or what happens in the transition regions of the gas disk (for instance, the inner rim) where dust can accumulate and where thermal diffusivity can increase/decrease?
For instance, we adopt a constant thermal diffusivity of X = 4.5 × 10⁻⁵r2pΩp in our simulations, in line with previous studies (e.g., Lega et al. 2014; Velasco Romero & Masset 2020) and consistent with the value used in our earlier works. This choice is motivated by the need to enable the formation of cold lobes around the planet, a key ingredient for generating thermal torques in non-luminous cases. Maintaining a constant value of χ allows us to construct a thermally controlled environment, which is essential for isolating the effects of dust feedback on the gas structure and the resulting torque balance near the planet, the main focus of this study.
Nevertheless, we acknowledge that this is a simplification. In realistic protoplanetary disks, the thermal diffusivity χ is expected to vary spatially as it depends on local physical conditions, notably the gas density, temperature, and the opacity of the medium (e.g., Kley et al. 2009; Jiménez & Masset 2017). Specifically, χ scales approximately as χ œ T3 /κ, where κ is the mean opacity, and T is the local temperature. Both of these quantities are, in turn, influenced by the local dust content, which depends on the size distribution, spatial concentration, and composition of the grains.
Our simulations show that the dust feedback onto the gas can significantly reshape the gas structure near the planet, particularly inside the cold lobes. These changes may, in principle, affect the distribution of dust, hence modifying the local temperature and opacity and, by extension, the thermal diffusivity. This leads to the intriguing possibility that χ itself may become asymmetric around the planet. Such an asymmetry could further distort the geometry of the cold lobes around the planet, increasing the asymmetry between the inner and outer contributions to the thermal torque, and thereby amplifying the net torque acting on the planet.
Exploring this effect in a self-consistent way would require a more complex, iterative modeling approach. First, one would need to simulate the coupled evolution of gas and dust, then calculate the local opacity from the dust distribution, update the temperature field and thermal diffusivity accordingly, and feed the resulting thermodynamic structure back into the dynamical evolution. This cycle would likely need to be repeated until a consistent steady state is reached. Additionally, this effort would require a more sophisticated treatment of dust opacity, including its dependence on composition, porosity, and mixing ratios, all of which remain highly uncertain and model-dependent.
Although this is undoubtedly a physically rich and promising problem - with potential implications for planetary migration, pebble accretion, and dust trapping - it falls beyond the scope of the present study. Here, our goal is to establish a first step in understanding how dust back reaction interacts with thermal forces in a controlled setup. The consideration of spatially varying thermal diffusivity due to evolving dust distributions will be an exciting direction for future investigations.
We also mention that, in this study we have ruled out the inclusion of the effects of viscous heating, although we are aware that in the case of ν = 10−5 r2pΩp it could have some possible effect on the gas dynamics, the dominant torque is that of dust. Lastly, we stress that, due to the high computational cost of our models, answering these questions is beyond the scope of this work. However, these questions definitely deserve to be addressed in future research.
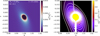 |
Fig. 6 Left. Perturbed gas density (code units) for the Mp0.3TD model with St = 0.1, at t = 10 orbits. Right. Cold thermal lobes in the gas component obtained from the subtraction of a simulation with thermal diffusivity (Mp0.3TD model) and an adiabatic simulation (Mp0.3AD model), at t = 10 orbits. Both models have St = 0.1. |
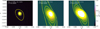 |
Fig. 7 Dust density distribution around planets with mass Mp = 0.3 M⊕ and Mp = 1.0 M⊕ for Stokes numbers of St = 0.01,0.1 (see text inside of the plots and Table 1). It can be clearly seen that in the case of St = 0.1 there is the formation of dust lobes reminiscent of cold thermal lobes in the gas component. |
6 Conclusions
We conducted high-resolution, three-dimensional, two-fluid simulations of a low-mass planet embedded in a disk of gas and dust, employing both local and global setups. In order to analyze the cold thermal torque (Lega et al. 2014; Masset 2017) under the influence of the aerodynamic back reaction of different dust species.
Within the framework of linear theory using local mesh models for a low-mass planet (Mp = 0.03 M⊕). We find that with increasing Stokes number, the dust feedback reduces the magnitude of the linear cold thermal torque and the gas torque thus progressively shifts closer to the adiabatic limit (see Fig. 1).
In global disk models, we have resolved the cold thermal lobes in the nonlinear regime and also captured the dust density structures responsible for the dust-driven torque. In these models, we find that regardless of the planet’s mass, there is a bifurcation determined by the Stokes number St = 0.01, clearly identifying when each torque component dominates. For St ≤ 0.01, the cold thermal torque dominates, since the formation of asymmetric substructures in the dust component that could contribute to the total torque on the planet is not observed. For St > 0.01, we find5 the formation of overdense dust lobes with an asymmetry that results in a negative total torque that becomes more negative over time. These lobes in the dust are reminiscent of the cold thermal lobes formed in the gas and are the result of considering a non-isothermal disk. The outcome suggests that the formation of dust lobes could produce an inward migration or even trigger a runaway migration similar to Chametla et al. (2025).
Our results show, for the first time, under which conditions each of the torque components controls the planet dynamics. An important implication is that, due to the bifurcation in the total torque at St = 0.01, if the planet reaches its pebble isolation mass (Lambrechts et al. 2014; Bitsch et al. 2018; Chametla et al. 2022), the migration would be governed by the cold thermal torque, since the pebble isolation mass allows only dust grains with St < 0.01 to enter the planet’s vicinity. On the other hand, in disk regions with large dust grains and an increased dust-togas ratio (as in pressure bumps), the planet’s dynamics should be governed by the dust lobes, i.e., the streaming torque.
Acknowledgements
This work was supported by the Czech Science Foundation (grant 21-23067M). The work of O.C. was supported by the Charles University Research Centre program (No. UNCE/24/SCI/005). Computational resources were available thanks to the Ministry of Education, Youth and Sports of the Czech Republic through the e-INFRA CZ (ID: 90254). JD and SC were funded by the European Union under the European Union’s Horizon Europe Research & Innovation Programme 101040037 (PLANETOIDS). GDM acknowledges the support from the European Research Council under the Horizon 2020 Framework Program via the ERC Advanced Grant “Origins” (PI: Henning), Nr. 832428, and under the European Union’s Horizon 2020 research and innovation programme “PROTOPLANETS” (PI: M. Benisty), No. 101002188. Views and opinions expressed are however those of the authors only and do not necessarily reflect those of the European Union or the European Research Council. Neither the European Union nor the granting authority can be held responsible for them. YH is supported by the Jet Propulsion Laboratory, California Institute of Technology, under a contract with the National Aeronautics and Space Administration (80NM0018D0004).
References
- Benítez-Llambay, P., & Masset, F. S. 2016, ApJS, 223, 11 [Google Scholar]
- Benítez-Llambay, P., & Pessah, M. E. 2018, ApJ, 855, L28 [Google Scholar]
- Benítez-Llambay, P., Masset, F., Koenigsberger, G., & Szulágyi, J. 2015, Nature, 520, 63 [Google Scholar]
- Benítez-Llambay, P., Krapp, L., & Pessah, M. E. 2019, ApJS, 241, 25 [Google Scholar]
- Benítez-Llambay, P., Krapp, L., Ramos, X. S., & Kratter, K. M. 2023, ApJ, 952, 106 [Google Scholar]
- Bitsch, B., Boley, A., & Kley, W. 2013, A&A, 550, A52 [NASA ADS] [CrossRef] [EDP Sciences] [Google Scholar]
- Bitsch, B., Morbidelli, A., Lega, E., & Crida, A. 2014, A&A, 564, A135 [NASA ADS] [CrossRef] [EDP Sciences] [Google Scholar]
- Bitsch, B., Morbidelli, A., Johansen, A., et al. 2018, A&A, 612, A30 [NASA ADS] [CrossRef] [EDP Sciences] [Google Scholar]
- Chametla, R. O., Chrenko, O., Masset, F. S., D’Angelo, G., & Nesvornÿ, D. 2025, A&A, 698, A21 [NASA ADS] [CrossRef] [EDP Sciences] [Google Scholar]
- Chametla, R. O., & Masset, F. S. 2021, MNRAS, 501, 24 [Google Scholar]
- Chametla, R. O., Masset, F. S., Baruteau, C., & Bitsch, B. 2022, MNRAS, 510, 3867 [Google Scholar]
- Chametla, R. O., Chrenko, O., Reyes-Ruiz, M., & Sánchez-Salcedo, F. J. 2024, MNRAS, 527, 11812 [Google Scholar]
- Chrenko, O., Chametla, R. O., Masset, F. S., Baruteau, C., & Broz, M. 2024, A&A, 690, A41 [NASA ADS] [CrossRef] [EDP Sciences] [Google Scholar]
- Crida, A., Griveaud, P., Lega, E., et al. 2022, in SF2A-2022: Proceedings of the Annual meeting of the French Society of Astronomy and Astrophysics, eds. J. Richard, A. Siebert, E. Lagadec, et al. 315 [Google Scholar]
- D’Angelo, G., & Bodenheimer, P. 2013, ApJ, 778, 77 [Google Scholar]
- de Val-Borro, M., Edgar, R. G., Artymowicz, P., et al. 2006, MNRAS, 370, 529 [Google Scholar]
- Dubrulle, B., Morfill, G., & Sterzik, M. 1995, Icarus, 114, 237 [Google Scholar]
- Eklund, H., & Masset, F. S. 2017, MNRAS, 469, 206 [NASA ADS] [CrossRef] [Google Scholar]
- Hasegawa, Y., Okuzumi, S., Flock, M., & Turner, N. J. 2017, ApJ, 845, 31 [NASA ADS] [CrossRef] [Google Scholar]
- Hou, Q., & Yu, C. 2024, ApJ, 972, 152 [Google Scholar]
- Hou, Q., & Yu, C. 2025, ApJ, 979, 185 [Google Scholar]
- Jiménez, M. A., & Masset, F. S. 2017, MNRAS, 471, 4917 [Google Scholar]
- Kley, W., Bitsch, B., & Klahr, H. 2009, A&A, 506, 971 [NASA ADS] [CrossRef] [EDP Sciences] [Google Scholar]
- Krapp, L., Kratter, K. M., Youdin, A. N., et al. 2024, ApJ, 973, 153 [NASA ADS] [CrossRef] [Google Scholar]
- Lambrechts, M., Johansen, A., & Morbidelli, A. 2014, A&A, 572, A35 [NASA ADS] [CrossRef] [EDP Sciences] [Google Scholar]
- Lega, E., Crida, A., Bitsch, B., & Morbidelli, A. 2014, MNRAS, 440, 683 [Google Scholar]
- Lesur, G., Ercolano, B., Flock, M., et al. 2022, arXiv e-prints [arXiv:2203.09821] [Google Scholar]
- Lesur, G., Latter, H. N., & Ogilvie, G. I. 2025, A&A, 703, A225 [NASA ADS] [CrossRef] [EDP Sciences] [Google Scholar]
- Masset, F. 2000, A&AS, 141, 165 [NASA ADS] [CrossRef] [EDP Sciences] [Google Scholar]
- Masset, F. S. 2017, MNRAS, 472, 4204 [NASA ADS] [CrossRef] [Google Scholar]
- Masset, F. S., & Benítez-Llambay, P. 2016, ApJ, 817, 19 [NASA ADS] [CrossRef] [Google Scholar]
- Morfill, G. E., & Voelk, H. J. 1984, ApJ, 287, 371 [Google Scholar]
- Müller, T. W. A., Kley, W., & Meru, F. 2012, A&A, 541, A123 [NASA ADS] [CrossRef] [EDP Sciences] [Google Scholar]
- Murray, C. D., & Dermott, S. F. 1999, Solar System Dynamics (Cambridge, UK: Cambridge University Press) [Google Scholar]
- Ogilvie, G. I., Latter, H. N., & Lesur, G. 2025, MNRAS, 537, 3349 [Google Scholar]
- Paardekooper, S. J., Baruteau, C., & Kley, W. 2011, MNRAS, 410, 293 [NASA ADS] [CrossRef] [Google Scholar]
- Paardekooper, S., Dong, R., Duffell, P., et al. 2023, in Astronomical Society of the Pacific Conference Series, 534, Protostars and Planets VII, eds. S. Inutsuka, Y. Aikawa, T. Muto, K. Tomida, & M. Tamura, 685 [Google Scholar]
- Regály, Z. 2020, MNRAS, 497, 5540 [CrossRef] [Google Scholar]
- Shakura, N. I., & Sunyaev, R. A. 1973, A&A, 24, 337 [NASA ADS] [Google Scholar]
- Tanaka, H., Takeuchi, T., & Ward, W. R. 2002, ApJ, 565, 1257 [Google Scholar]
- Vaidya, B., Mignone, A., Bodo, G., & Massaglia, S. 2015, A&A, 580, A110 [NASA ADS] [CrossRef] [EDP Sciences] [Google Scholar]
- Velasco Romero, D. A., & Masset, F. S. 2020, MNRAS, 495, 2063 [Google Scholar]
- Velasco Romero, D. A., Masset, F. S., & Teyssier, R. 2022, MNRAS, 509, 5622 [Google Scholar]
- Ward, W. R. 1986, Icarus, 67, 164 [Google Scholar]
- Weber, P., Benítez-Llambay, P., Gressel, O., Krapp, L., & Pessah, M. E. 2018, ApJ, 854, 153 [NASA ADS] [CrossRef] [Google Scholar]
- Zhu, Z., Stone, J. M., & Bai, X.-N. 2015, ApJ, 801, 81 [NASA ADS] [CrossRef] [Google Scholar]
We stress that while thermal diffusivity could drive a change in the Lindblad torque (Paardekooper et al. 2011), the values considered here in the local and global models fall within the thermal diffusivity values typical of protoplanetary disks ~1015 cm2 s−1 (Bitsch et al. 2014; Lega et al. 2014; Benítez-Llambay et al. 2015) and its effect is mostly reflected in the cold thermal torque (see Masset 2017).
To create the high resolution mesh around the planet and a smooth transition with the coarse mesh, we use the coefficients αr = aφ = 0.2618, br = bφ = 0.3141, cr = 15.0 and cφ = 1.5, respectively.
The public version of the code without the thermal diffusion module is available at https://fargo3d.github.io/documentation/
In fact, for the threshold value of the Stokes number above which dust toque becomes important, it can be readily estimated: in order for dust torque to become comparable to gas torque, their densities should be comparable at the midplane, that is  . From Eq. (23),
  . Then the required value of St is:
  which is in agreement with our numerical results.
Appendix A Approximate isotropic low-turbulent diffusion
In the isotropic approximation of turbulent diffusion, the gas turbulence parameterized by alpha is assumed to be of the same magnitude as the dust turbulent diffusion. Chametla et al. (2025) recently studied the dust distribution around an Earth-like planet embedded in an isothermal protoplanetary disk. They found that in the low-turbulent regime δ = α = 10−5, a dust void forms behind the planet and a trench in front of it. The dust void is partially delimited by a high-density and a low-density filament (see their figure 4). Here, we similarly find the formation of a dust void and a trench, as well as a pair of low- and high-density structures around them (see Fig. A.1).
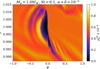 |
Fig. A.1 Dust-void structure at t = 10 orbits, created by an Earth-like planet embedded in a protoplanetary disk with an isotropic turbulent diffusion. |
Appendix B Smoothing length impact in 3D global models
In Fig. B.1 we show the dust density distribution around a planet with Mp = 1.0M⊙ for Stokes numbers of St = 0.01 (left panel) and St = 0.1 (right panel) considering a smoothing length of rsm = 0.03Hg, three times larger than that of our global simulations. We find that, for these values of the Stokes number, rsm has only a weak impact on the gas and dust densities, and hence the total torque on the planet. For St = 0.01 the change in dust density was less than 2%, and for St = 0.1 it was less than 5% (see Fig. 7 in the main text). Interestingly, we find a small decrease in the dust torque in both cases, similar to what occurs in 2D simulations (see Regály 2020). In a forthcoming paper (Chametla et al. in prep.), this effect of the smoothing length and the accretion of gas (heating torque component) and dust by the planet will be addressed since, as recently shown in 2D models (Chrenko et al. 2024), the accretion of pebbles can considerably change the torque on the planet.
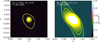 |
Fig. B.1 Dust density distribution in global models around of a planet with Mp = 1.0M⊕ and Stokes numbers of St = 0.01 and 0.1 for the case of larger smoothing length than the one used in the main text. |
All Tables
All Figures
|
Fig. 1 Normalized gas torque as a function of time in the linear case (xp/λc ≈ 0.57) for different values of St. The horizontal dotted line shows the torque value expected in the adiabatic disk according to Jiménez & Masset (2017) which we have included as a reference value. The right vertical axis corresponds to the usual normalization of the torque. |
| In the text | |
|
Fig. 2 Normalized total torque (gas plus dust) as a function of time in the settling regime for global models (see Table 1) when St = 10−3. Althoughxp/λc ≈ 0.45 for all simulations, the smallest mass of the planets considered here is equal to the critical mass Mc (see Eq. (13)), so these models can be classified beyond the linear theory. The dashed gray lines overlapped on the curves represent the torque value of the gas component. For all planet masses, the gas component dominates the total torque. |
| In the text | |
|
Fig. 3 Normalized total torque (gas plus dust) as a function of time in the settling regime, for the global models Mp0.3AD and Mp0.3TD (see Table 1) considering that St = {0.0,0.1}. The total torque is dominated by the dust torque. |
| In the text | |
|
Fig. 4 Similar to Fig. 3 but for a planetary mass of Mp = 1.0 M⊕ and St = 0.1. It can clearly be seen that the total torque is dominated by the dust torque component. |
| In the text | |
|
Fig. 5 Same as Fig. 4 but for St = 0.01. In this case, we see that the total torque is dominated by the gas torque component. |
| In the text | |
|
Fig. 6 Left. Perturbed gas density (code units) for the Mp0.3TD model with St = 0.1, at t = 10 orbits. Right. Cold thermal lobes in the gas component obtained from the subtraction of a simulation with thermal diffusivity (Mp0.3TD model) and an adiabatic simulation (Mp0.3AD model), at t = 10 orbits. Both models have St = 0.1. |
| In the text | |
|
Fig. 7 Dust density distribution around planets with mass Mp = 0.3 M⊕ and Mp = 1.0 M⊕ for Stokes numbers of St = 0.01,0.1 (see text inside of the plots and Table 1). It can be clearly seen that in the case of St = 0.1 there is the formation of dust lobes reminiscent of cold thermal lobes in the gas component. |
| In the text | |
|
Fig. A.1 Dust-void structure at t = 10 orbits, created by an Earth-like planet embedded in a protoplanetary disk with an isotropic turbulent diffusion. |
| In the text | |
|
Fig. B.1 Dust density distribution in global models around of a planet with Mp = 1.0M⊕ and Stokes numbers of St = 0.01 and 0.1 for the case of larger smoothing length than the one used in the main text. |
| In the text | |
Current usage metrics show cumulative count of Article Views (full-text article views including HTML views, PDF and ePub downloads, according to the available data) and Abstracts Views on Vision4Press platform.
Data correspond to usage on the plateform after 2015. The current usage metrics is available 48-96 hours after online publication and is updated daily on week days.
Initial download of the metrics may take a while.