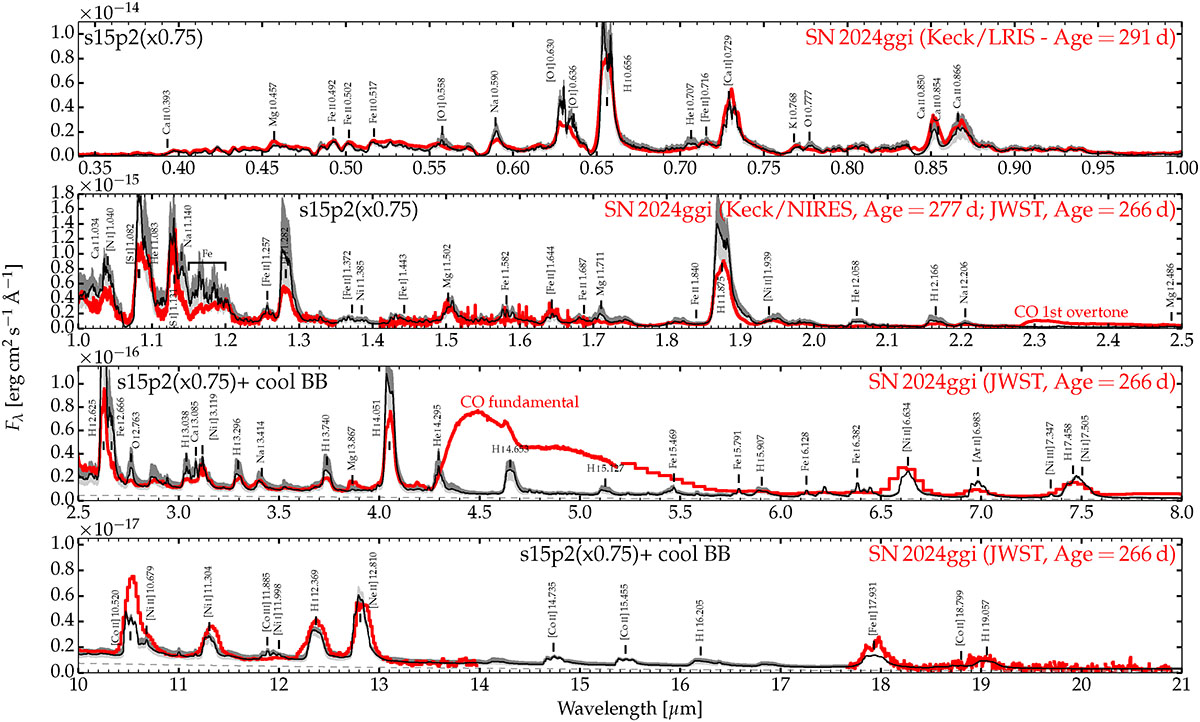
Fig. 1.
Download original image
Comparison between the optical-to-infrared spectroscopic observations of SN 2024ggi at 266–291 d (red; see Appendix B) with model s15p2 interpolated to the same epoch and scaled by a factor of 0.75 (black). Each panel covers the optical, near-infrared, and mid-infrared ranges (top to bottom). The data were corrected for redshift and reddening, and the model was scaled to the SN distance. The flux shift corresponding to the same model but at ±30 d is shown in light/dark gray. The labels indicate the main emission features. To facilitate comparison, the flux from the radiative-transfer model was augmented by a composite blackbody spectrum, which may arise from molecular emission (dashed; the blackbody temperatures and radii are 1230/400 K and 0.8/5.0 × 1015 cm). The region between 8 and 10 μm, which appears featureless with only weak SiO emission, is shown in Fig. B.1.
Current usage metrics show cumulative count of Article Views (full-text article views including HTML views, PDF and ePub downloads, according to the available data) and Abstracts Views on Vision4Press platform.
Data correspond to usage on the plateform after 2015. The current usage metrics is available 48-96 hours after online publication and is updated daily on week days.
Initial download of the metrics may take a while.