| Issue |
A&A
Volume 704, December 2025
|
|
|---|---|---|
| Article Number | L6 | |
| Number of page(s) | 8 | |
| Section | Letters to the Editor | |
| DOI | https://doi.org/10.1051/0004-6361/202556304 | |
| Published online | 02 December 2025 | |
Letter to the Editor
An optical-to-infrared study of type II SN 2024ggi at nebular times
1
Institut d’Astrophysique de Paris, CNRS-Sorbonne Université, 98 bis boulevard Arago, F-75014 Paris, France
2
Department of Physics and Astronomy, FI-20014 University of Turku, Turku, Finland
3
Cahill Center for Astrophysics, California Institute of Technology, Pasadena, CA 91125, USA
4
Caltech Optical Observatories, California Institute of Technology, Pasadena, CA 91125, USA
⋆ Corresponding author: This email address is being protected from spambots. You need JavaScript enabled to view it.
Received:
8
July
2025
Accepted:
8
November
2025
Abstract
We present 0.3–21 μm observations at ∼275 d and ∼400 d of type II supernova (SN) 2024ggi that combined ground-based optical and near-infrared data from the Keck I/II telescopes and space-based infrared data from the James Webb Space Telescope. Although the optical regions dominate the observed flux, SN 2024ggi is bright at infrared wavelengths (65% and 35% fall each side of 1 μm). SN 2024ggi exhibits a plethora of emission lines from H, He, intermediate-mass elements (O, Na, Mg, S, Ar, and Ca), and iron-group elements (IGEs; Fe, Co, and Ni). The width of all lines is essentially the same, which suggests efficient macroscopic chemical mixing of the inner ejecta at ≲2000 km s−1 and little mixing of 56Ni at higher velocities. Molecular emission in the infrared range is dominated by the CO fundamental, which radiates about 5% of the total SN luminosity. A molecule-free radiative-transfer model based on a standard explosion of a red supergiant star (i.e., ∼1051 erg, 0.06 M⊙ of 56Ni from a 15.2 M⊙ progenitor) yields a satisfactory match throughout the optical and infrared at both epochs. The SN 2024ggi CO luminosity is comparable to the fractional decay power absorbed in the model C/O-rich shell. An accounting for CO cooling would likely resolve the model overestimate of the [O I] 0.632 μm flux. The relative weakness of the molecular emission in SN 2024ggi and the good overall match obtained with our molecule-free model suggests negligible microscopic mixing; about 95% of the SN luminosity is radiated by atoms and ions. The lines from IGEs, which form from explosion ashes at these late times, are ideal diagnostics of the magnitude of 56Ni mixing in core-collapse SN ejecta. Stable Ni, which was identified in SN 2024ggi (e.g., [Ni II] 6.634 μm), is probably a common product of explosions of massive stars.
Key words: line: formation / radiative transfer / supernovae: general
NASA Hubble Fellow.
© The Authors 2025
 Open Access article, published by EDP Sciences, under the terms of the Creative Commons Attribution License (https://creativecommons.org/licenses/by/4.0), which permits unrestricted use, distribution, and reproduction in any medium, provided the original work is properly cited.
This article is published in open access under the Subscribe to Open model. This email address is being protected from spambots. You need JavaScript enabled to view it. to support open access publication.
1. Introduction
Nebular-phase panchromatic observations of the low-energy radiation from core-collapse supernovae (SNe) are a major step toward a complete characterization of the ejecta composition. The composition carries a wealth of information on the pre-SN evolution and explosive nucleosynthesis. A comprehensive spectroscopic dataset that extends into the infrared has so far been limited to SN 1987A, which was observed by the Kuiper Airborne Observatory (Wooden et al. 1993), and to a few type II plateau SNe observed by the Spitzer Space Telescope (e.g., Kotak et al. 2005, 2006, 2009; Fabbri et al. 2011; Meikle et al. 2011). These optical-to-infrared observations essentially contain 100% of the SN radiation in noninteracting SNe II, capture the weak emission from underabundant metals such as Ar or Ni, which are typically unavailable in the optical, and allow for a complete census of atoms, ions, and molecules that cool the decay-powered ejecta at nebular times (Jerkstrand et al. 2012; Liljegren et al. 2020, 2023; Dessart et al. 2021; McLeod et al. 2024; Dessart 2025a).
In this Letter, we report on the nearby type II SN 2024ggi for which we present Keck Low Resolution Imaging Spectrometer (LRIS), Keck Near-Infrared Echellette Spectrometer (NIRES), and James Webb Space Telescope (JWST) Near Infrared Spectrograph (NIRSPEC) and Mid-InfraRed Instrument (MIRI) observations at two nebular epochs of about 300 and 400 d after explosion (see Appendix B for a complete description of the observational dataset). This object received much attention because it was discovered as the shock broke out from the stellar surface (Jacobson-Galán & Davis 2024; Shrestha et al. 2024; Zhang et al. 2024; Chen et al. 2024, 2025). This breakout persisted over days as the shock crossed extended dense circumstellar material, as evidenced by the presence of narrow emission lines, whose widths grew as a result of the acceleration imparted by the SN radiation (Pessi et al. 2024; Shrestha et al. 2024; Dessart 2025b). After one to two weeks, SN 2024ggi evolved into a standard type II SN (Ertini et al. 2025), with properties reminiscent of those of SN 1999em (Leonard et al. 2002; Elmhamdi et al. 2003; Dessart et al. 2013).
In the next section, we analyze our observational dataset of SN 2024ggi and compare it to the radiative-transfer models of Dessart (2025a). We then present our conclusions in Section 3. Throughout this work, we adopted the following observational characteristics for SN 2024ggi: a reddening E(B − V) of 0.07 mag due to the Milky Way (Schlegel et al. 1998; Schlafly & Finkbeiner 2011) and 0.084 mag due to the host galaxy (Jacobson-Galán & Davis 2024), a redshift of 0.002215 (Jacobson-Galán & Davis 2024), a redshift-independent host-galaxy distance of 7.24 Mpc (Saha et al. 2006), and a time of first light at MJD 60410.56 (Jacobson-Galán & Davis 2024). Supplementary information on this work is provided in the appendix.
2. Analysis
Figures 1 and 2 present the full optical-to-infrared observations of SN 2024ggi at ∼275 d and ∼400 d, which continuously cover from 0.32 up to ∼21 μm except for a few gaps that are due to atmospheric absorption (NIRES data) or the instrumental setup we selected (JWST data). These data are compared to the s15p2 radiative-transfer model from Dessart (2025a), computed with CMFGEN (Hillier & Dessart 2012), which was originally presented by Dessart et al. (2021) and was based on the s15.2 explosion model of Sukhbold et al. (2016). This model is for a 15.2 M⊙ star that evolved at solar metallicity and reached core collapse as a 12.58 M⊙ red supergiant star, and that ejected 10.95 M⊙ of material with 0.84 × 1051 erg and 0.063 M⊙ of 56Ni following explosion. These properties are comparable to those inferred by Ertini et al. (2025) from radiation-hydrodynamics modeling of the light curve and the photospheric velocity evolution. Our radiative-transfer model only treats atoms and ions in the ejecta material, and it thus ignores molecules and dust. The lack of a peculiar blue optical color or broad boxy emission profiles (Dessart & Hillier 2022; Dessart et al. 2023) suggests that there is little interaction with circumstellar material in SN 2024ggi at these epochs (see, e.g., SN 2023ixf, where these signatures are identified; Folatelli et al. 2025; Jacobson-Galán et al. 2025; Kumar et al. 2025; Zheng et al. 2025). We thus only accounted for radioactive decay power in our s15p2 model (specifically, we accounted for the two-step decay chains whose parent isotopes are 44Ti, 48Cr, 52Fe, 56Ni, and 57Ni; see Dessart 2025a).
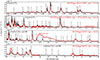 |
Fig. 1. Comparison between the optical-to-infrared spectroscopic observations of SN 2024ggi at 266–291 d (red; see Appendix B) with model s15p2 interpolated to the same epoch and scaled by a factor of 0.75 (black). Each panel covers the optical, near-infrared, and mid-infrared ranges (top to bottom). The data were corrected for redshift and reddening, and the model was scaled to the SN distance. The flux shift corresponding to the same model but at ±30 d is shown in light/dark gray. The labels indicate the main emission features. To facilitate comparison, the flux from the radiative-transfer model was augmented by a composite blackbody spectrum, which may arise from molecular emission (dashed; the blackbody temperatures and radii are 1230/400 K and 0.8/5.0 × 1015 cm). The region between 8 and 10 μm, which appears featureless with only weak SiO emission, is shown in Fig. B.1. |
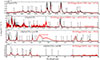 |
Fig. 2. Same as Fig. 1, but now for the observations of SN 2024ggi at about 400 d and the contemporaneous model s15p2. |
These nebular spectra of SN 2024ggi exhibit H I lines from the Balmer (i.e., Hα and Hβ) to the Paschen (e.g., 1.875 and 1.282 μm), Brackett (e.g., 4.051, 2.625, and 2.166 μm), Pfund (7.458, 4.653, and 3.740 μm), Humphreys (e.g., 12.369 μm), and up to the seventh series with 19.057 μm. The strong He I 1.083 μm contributes to the emission at 1.08 μm (another contributor is [S I] 1.082 μm), but other He I lines are weak (e.g., at 0.707 μm) or not clearly observed (i.e., at 2.058 μm and 4.295 μm). The lines of C and N are essentially invisible, but O contributes a strong optical line with [O I] 0.632 μm ([O I] 0.558 μm and O I 0.774 μm are weak) with perhaps a weak emission at 2.763 μm. Neon contributes a strong forbidden-line emission at 12.810 μm. [Ne III] 15.550 μm was not observed in our setup. A few weak Na I lines are present at 1.140, 2.206, and 3.414 μm. Weak Mg I lines are present at 1.502 and 1.711 μm. Sulfur contributes one emission at 1.082 μm that overlaps He I 1.083 μm. Argon contributes one isolated forbidden-line emission with [Ar II] 6.983 μm. The resonant transition of K I at 0.768 μm is also present (not to be confused with O I at 0.777 μm). Calcium mostly contributes in the optical with [Ca II] 0.731 μm and the Ca II near-infrared triplet. There are numerous typically isolated emission lines from Fe, Co, and Ni in the infrared, in contrast with the optical, where iron-group elements contribute primarily with forests of lines of Fe II and Fe I. One exception is [Ni II] 0.738 μm although this is ambiguous because it overlaps with [Ca II] 0.731 μm and there is a background of Fe lines. We identify a forest of Fe I and Fe II lines up to two microns, [Fe II] at 17.931 μm, Co with [Co II] 10.520 μm, and a number of Ni lines with [Ni II] at 1.939, 6.634, and 10.679 μm, and [Ni I] at 3.119, 7.505 and 11.304 μm.
The model s15p2 at ∼275 d from Dessart (2025a), distance-scaled to 7.24 Mpc (with an additional scaling of 0.75 to match the inferred bolometric luminosity of 5.67 × 1040 erg s−1 of SN 2024ggi; the original s15p2 model has slightly too much 56Ni or possibly traps the associated γ rays too efficiently) yields a satisfactory match to the observations of SN 2024ggi from the optical to the infrared (Fig. 1; to give a sense of the temporal evolution, the flux shift from the model predictions 30 d prior or after are indicated with a dark/light gray shading). A similar match is obtained for the second epoch of observations at about 400 d (Fig. 2; see also Fig. B.1, where both observations are shown). This suggests that the overall characteristics of the ejecta (i.e., primarily the yields) are broadly consistent. The model is too bright in all H I lines by several 10%, however, which suggests that too much decay power is absorbed by H-rich material. In our shuffled-shell model, 2.2 M⊙ from the H-rich ejecta was mixed in, which may be slightly too much. When this amount is lowered to 1.4 M⊙ this discrepancy is partly reduced by about 10%. Invoking a lower 56Ni mass might help, although this tends to primarily induce a global reduction of the model flux. A more promising alternative is an enhanced γ-ray escape, as would result from a lighter progenitor H-rich envelope or a higher kinetic energy of the ejecta. The weak helium lines are also overestimated. The intermediate-mass elements match all lines well, although the model overestimates [O I] 0.632 μm (with a line luminosity of 3.1 compared to 2.0 × 1039 erg s−1) and [Ne II] 12.810 μm. A lower-mass progenitor of 13 or 14 M⊙ might solve these two discrepancies because of their lower O and Ne yields (Dessart et al. 2021, see also Appendix A.1 and Fig. A.1). If we had treated molecular cooling in our model, however, this [O I] 0.632 μm emission would be weaker, which means that this overestimate is in practice a desirable offset. CO molecules cannot form in the C-poor O/Ne/Mg shell (see also Liljegren et al. 2023), where [Ne II] 12.810 μm forms. This means that a lower Ne abundance is likely required. The strength of [Ar II] 6.983 μm is overestimated. This line forms in the Fe-rich and Si-rich regions and to a lesser extent in the He-rich shell, but is a secondary coolant (it contains ≲0.2% of the model luminosity). A lower Ar abundance might resolve this discrepancy. The strength of this line in the sample of core-collapse SNe of Dessart (2025a) is significantly heterogeneous. Their model s15p2 yields the greatest strength (see Fig. A.1 and further discussion in Appendix A.1). The forest of Fe line emission in the optical and the more isolated Fe, Co, and Ni lines in the infrared are well matched by the model. The shapes of these individual lines are similar, and the lines form in regions with ≲2000 km s−1 in common with all other elements from H, He, and intermediate-mass elements, which suggests a complete macroscopic mixing of the preSN shell-like composition structure in the inner ejecta (see Figs. A.3–A.4). This confirms that stable Ni is probably rather common in core-collapse SN ejecta. Other examples include SN 1987A or SN 2004et, but this is hard to infer from optical spectra with the contaminated [Ni II] 0.738 μm line (Jerkstrand et al. 2015). These spectral properties thus show how strikingly different the atomic properties of different species are in terms of the number of lines and in terms of their distribution with wavelength. A vivid representation is given in Fig. A.2.
To evaluate the quality of the fits, we first recall that the majority of the flux is emitted below 1 μm (62% for SN 2024ggi and 68% for the model, both at ∼275 d), and the optical emission lines and not the molecules therefore perform the bulk of the ejecta cooling (Fig. 3). At below 2 μm, this percentage grows to 84% and 93%. The difference in the flux distribution between SN 2024ggi and the s15p2 model primarily arises from CO molecular cooling, and in particular, from the CO fundamental, whose luminosity at ∼275 d is ∼3 × 1039 erg s−1 (or ∼5% of the total luminosity) and is zero in the model. Interestingly, this corresponds to the fractional decay power that is absorbed in the C/O-rich material of our model s15p2 (where CO would form), which would suggest that had we treated molecules in our calculation, CO would probably have been the exclusive coolant of the C/O-rich material (expansion cooling is subdominant at these late epochs). Because the O-rich material absorbs ∼20% of the total decay power, however, it would only have reduced the model [O I] 0.632 μm line strength by only 20–30%. This resolves the discrepancy ([O I] 0.632 μm is not the only coolant of the O-rich material in the model; see Dessart et al. 2021).
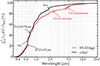 |
Fig. 3. Fractional luminosity integrated from 0.3 to 21 μm for the first epoch of observations of SN 2024ggi and model s15p2 at 275 d. The data were corrected for redshift and reddening. A linear interpolation is used to infer the flux in regions without data. |
3. Conclusions
In this Letter, we have presented ground- and space-based optical-to-infrared observations at ∼275 d and ∼400 d of SN 2024ggi together with the s15p2 radiative-transfer model from Dessart (2025a), which is based on a model from Sukhbold et al. (2016), for a standard explosion of a star with an initial mass of 15.2 M⊙. Whereas the optical range is dominated by a forest of overlapping Fe emission lines and a few strong lines of H, O, and Ca, the infrared range reveals a wealth of lines with a comparable width from H, He, to O, Na, Mg, S, Ar, and Fe, Co, or Ni. This suggests efficient macroscopic chemical mixing of the inner ejecta and little mixing of 56Ni at higher velocities. Strong CO emission is observed in SN 2024ggi, corresponding to 5% of the total luminosity. The model performs well against these panchromatic observations even though it neglects molecules. This supports the hypothesis that CO forms in a very restricted volume of the ejecta (i.e., the C/O-rich material). A more uniform distribution of CO would alter the temperature, ionization, and coolants throughout and would strongly affect the resulting spectrum (see the example in McLeod et al. 2024). When we assume that 20–30% of the model [O I] 0.632 μm flux should have gone into CO emission, a progenitor mass of ∼15 M⊙ seems compatible with the SN 2024ggi spectra. This is in line with the inferences of Hueichapán et al. (2025, 14 M⊙) and Ferrari et al. (2025, 12–15 M⊙), which were based on individual optical line diagnostics or radiative-transfer models that did not include molecular cooling. This value is also close to the inference of Xiang et al. (2024, 13 M⊙) from pre-explosion imaging photometry, but it differs from the 10.2 M⊙ from a study of the SN environment (Hong et al. 2024).
The effect of neglecting CO molecular cooling in core-collapse SN models can be evaluated, in particular, the effect on the strength of [O I] 0.632 μm. The maximum possible CO cooling power is the decay power that is absorbed in the C/O-rich layers of the ejecta. When we assume that [O I] 0.632 μm forms throughout the O-rich material and that the deposition of γ-rays in this region is uniform, the reduction in [O I] 0.632 μm line flux is equal to just M(C/O-sh)/M(O-sh). As shown in Fig. 4 for a subset of explosion models from Sukhbold et al. (2016), the C/O-rich shell is typically 30% of the O-rich shell in > 12 M⊙ progenitors, which sets a strict limit of 30% to the reduction of the [O I] 0.632 μm flux by CO molecular cooling. Because of the low O-shell mass and potentially higher fractional mass occupied by the C/O-rich shell, CO molecular cooling in lower-mass progenitors might lead to a severe reduction of the inherently weak [O I] 0.632 μm flux. This might explain the SNe II without [O I] 0.632 μm.
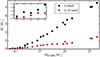 |
Fig. 4. Mass of the O-rich shell (black) and the C/O-rich shell (red) in the explosion models of Sukhbold et al. (2016) with a zero-age main-sequence mass (MZAMS) in the range 9.0–26.5 M⊙. The inset zooms in on the lower-mass progenitors and their very low metal yields. |
Acknowledgments
This work is based in part on observations made with the NASA/ESA/CSA James Webb Space Telescope. The data were obtained from the Mikulski Archive for Space Telescopes at the Space Telescope Science Institute, which is operated by the Association of Universities for Research in Astronomy, Inc., under NASA contract NAS 5-03127 for JWST. We are grateful for the allocation of JWST DDT time to programmes 6678 (PI: Kotak) and 6716 (PI: Ashall). Some of the data presented herein were obtained at the W. M. Keck Observatory, which is operated as a scientific partnership among the California Institute of Technology, the University of California, and NASA. The Observatory was made possible by the generous financial support of the W. M. Keck Foundation. The authors wish to recognize and acknowledge the very significant cultural role and reverence that the summit of Maunakea has always had within the indigenous Hawaiian community. We are most fortunate to have the opportunity to conduct observations from this mountain. RK acknowledges support from the Research Council of Finland (340613). W.J.-G. is supported by NASA through Hubble Fellowship grant HSTHF2-51558.001-A awarded by the Space Telescope Science Institute, which is operated for NASA by the Association of Universities for Research in Astronomy, Inc., under contract NAS5-26555.
References
- Bushouse, H., Eisenhamer, J., Dencheva, N., et al. 2025, https://doi.org/10.5281/zenodo.17515973 [Google Scholar]
- Chen, X., Kumar, B., Er, X., et al. 2024, ApJ, 971, L2 [Google Scholar]
- Chen, T.-W., Yang, S., Srivastav, S., et al. 2025, ApJ, 983, 86 [Google Scholar]
- Cushing, M. C., Vacca, W. D., & Rayner, J. T. 2004, PASP, 116, 362 [NASA ADS] [CrossRef] [Google Scholar]
- Dessart, L. 2025a, A&A, 703, A287 [NASA ADS] [CrossRef] [EDP Sciences] [Google Scholar]
- Dessart, L. 2025b, A&A, 694, A132 [NASA ADS] [CrossRef] [EDP Sciences] [Google Scholar]
- Dessart, L., & Hillier, D. J. 2022, A&A, 660, L9 [NASA ADS] [CrossRef] [EDP Sciences] [Google Scholar]
- Dessart, L., Hillier, D. J., Waldman, R., & Livne, E. 2013, MNRAS, 433, 1745 [NASA ADS] [CrossRef] [Google Scholar]
- Dessart, L., Hillier, D. J., Sukhbold, T., et al. 2021, A&A, 652, A64 [NASA ADS] [CrossRef] [EDP Sciences] [Google Scholar]
- Dessart, L., Gutiérrez, C. P., Kuncarayakti, H., et al. 2023, A&A, 675, A33 [NASA ADS] [CrossRef] [EDP Sciences] [Google Scholar]
- Elmhamdi, A., Danziger, I. J., Chugai, N., et al. 2003, MNRAS, 338, 939 [CrossRef] [Google Scholar]
- Ertini, K., Regna, T. A., Ferrari, L., et al. 2025, A&A, 699, A60 [NASA ADS] [CrossRef] [EDP Sciences] [Google Scholar]
- Fabbri, J., Otsuka, M., Barlow, M. J., et al. 2011, MNRAS, 418, 1285 [CrossRef] [Google Scholar]
- Ferrari, L., Folatelli, G., Ertini, K., et al. 2025, A&A, 703, A12 [NASA ADS] [CrossRef] [EDP Sciences] [Google Scholar]
- Folatelli, G., Ferrari, L., Ertini, K., et al. 2025, A&A, 698, A213 [NASA ADS] [CrossRef] [EDP Sciences] [Google Scholar]
- Hillier, D. J., & Dessart, L. 2012, MNRAS, 424, 252 [CrossRef] [Google Scholar]
- Hong, X., Sun, N.-C., Niu, Z., et al. 2024, ApJ, 977, L50 [Google Scholar]
- Hueichapán, E., Cartier, R., Prieto, J. L., et al. 2025, ApJ, submitted [arXiv:2508.02656] [Google Scholar]
- Jacobson-Galán, W. V., Davis, K. W., et al. 2024, ApJ, 972, 177 [CrossRef] [Google Scholar]
- Jacobson-Galán, W. V., Dessart, L., Davis, K. W., et al. 2025, ApJ, 992, 100 [Google Scholar]
- Jerkstrand, A., Fransson, C., Maguire, K., et al. 2012, A&A, 546, A28 [NASA ADS] [CrossRef] [EDP Sciences] [Google Scholar]
- Jerkstrand, A., Smartt, S. J., Sollerman, J., et al. 2015, MNRAS, 448, 2482 [Google Scholar]
- Kotak, R., Meikle, P., van Dyk, S. D., et al. 2005, ApJ, 628, L123 [Google Scholar]
- Kotak, R., Meikle, P., Pozzo, M., et al. 2006, ApJ, 651, L117 [Google Scholar]
- Kotak, R., Meikle, W. P. S., Farrah, D., et al. 2009, ApJ, 704, 306 [NASA ADS] [CrossRef] [Google Scholar]
- Kumar, A., Dastidar, R., Maund, J. R., et al. 2025, MNRAS, 538, 659 [Google Scholar]
- Leonard, D. C., Filippenko, A. V., Gates, E. L., et al. 2002, PASP, 114, 35 [Google Scholar]
- Liljegren, S., Jerkstrand, A., & Grumer, J. 2020, A&A, 642, A135 [EDP Sciences] [Google Scholar]
- Liljegren, S., Jerkstrand, A., Barklem, P. S., et al. 2023, A&A, 674, A184 [NASA ADS] [CrossRef] [EDP Sciences] [Google Scholar]
- McLeod, C., Hillier, D. J., & Dessart, L. 2024, MNRAS, 532, 549 [Google Scholar]
- Meikle, W. P. S., Kotak, R., Farrah, D., et al. 2011, ApJ, 732, 109 [Google Scholar]
- Oke, J. B., Cohen, J. G., Carr, M., et al. 1995, PASP, 107, 375 [Google Scholar]
- Perley, D. A. 2019, PASP, 131, 084503 [Google Scholar]
- Pessi, T., Cartier, R., Hueichapan, E., et al. 2024, A&A, 688, L28 [NASA ADS] [CrossRef] [EDP Sciences] [Google Scholar]
- Saha, A., Thim, F., Tammann, G. A., et al. 2006, ApJS, 165, 108 [NASA ADS] [CrossRef] [Google Scholar]
- Schlafly, E. F., & Finkbeiner, D. P. 2011, ApJ, 737, 103 [Google Scholar]
- Schlegel, D. J., Finkbeiner, D. P., & Davis, M. 1998, ApJ, 500, 525 [Google Scholar]
- Shrestha, M., Bostroem, K. A., Sand, D. J., et al. 2024, ApJ, 972, L15 [Google Scholar]
- Sukhbold, T., Ertl, T., Woosley, S. E., et al. 2016, ApJ, 821, 38 [NASA ADS] [CrossRef] [Google Scholar]
- Vacca, W. D., Cushing, M. C., & Rayner, J. T. 2003, PASP, 115, 389 [NASA ADS] [CrossRef] [Google Scholar]
- Wilson, J. C., Henderson, C. P., Herter, T. L., et al. 2004, SPIE, 5492, 1295 [Google Scholar]
- Wooden, D. H., Rank, D. M., Bregman, J. D., et al. 1993, ApJS, 88, 477 [NASA ADS] [CrossRef] [Google Scholar]
- Xiang, D., Mo, J., Wang, X., et al. 2024, ApJ, 969, L15 [Google Scholar]
- Zhang, J., Dessart, L., Wang, X., et al. 2024, ApJ, 970, L18 [NASA ADS] [CrossRef] [Google Scholar]
- Zheng, W., Dessart, L., Filippenko, A. V., et al. 2025, ApJ, 988, 61 [Google Scholar]
Appendix A: Additional results
A.1. Strength of [Ar II] 6.983 μm, [Ne II] 12.810 μm, and [O I] 0.632 μm in the core-collapse SN models
The left panel of Fig. A.1 illustrates the fractional luminosity radiated in [Ar II] 6.983 μm from 200 to 500 d after explosion in the sample of models presented in Dessart (2025a). Line [Ar II] 6.983 μm is strongest (weakest) in model s15p2 (s18p5), partly as a result of the difference in Ar abundance (0.011 vs 0.004 M⊙). There is a lot of scatter in that Ar yield since model s21p5 has 0.016 M⊙ of Ar whereas models s10p0 and s12p0 are down at about 0.002 M⊙. Variations in Ar abundance, in ionization (driven in part from changes in density and expansion rate), decay-power absorbed, and other coolants (e.g., the Ca abundance also shows a monotonic trend with initial mass, while it is the strongest coolant of the Fe-rich and Si-rich material) may all impact the [Ar II] 6.983 μm line strength.
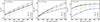 |
Fig. A.1. Evolution of the percentage fraction of the bolometric flux that is radiated in [Ar II] 6.983 μm (left), [Ne II] 12.810 μm (middle), and [O I] 0.632 μm (right) for a sample of core-collapse SN models from Dessart (2025a). |
The middle panel of Fig. A.1 is a counterpart of the left panel for [Ne II] 12.810 μm. As for [Ar II] 6.983 μm, model s15p2 shows the strongest [Ne II] 12.810 μm luminosity. Unlike for Ar, the Ne abundance evolves monotonically with initial mass, increasing from ∼ 0.01 up to ∼ 0.6 M⊙ for initial masses between 10.0 and 21.5 M⊙. Here, the variation in the strength of [Ne II] 12.810 μm is both driven by this abundance variation and changes in ionization (see Section 5 of Dessart 2025a). So, a slightly lower initial mass and greater density (as would result for example from clumping) could bring the model [Ne II] 12.810 μm into agreement with the observed line in SN 2024ggi. The right panel of Fig. A.1 shows the fractional luminosity radiated in [O I] 0.632 μm for the same sample, which exhibits a monotonic trend with initial mass as well as a strength that is typically ten times greater than [Ne II] 12.810 μm. These models ignore cooling by molecules.
A.2. Elemental contribution to the s15p2 model flux at 300 d
Figure A.2 illustrates more explicitly for model s15p2 at 300 d the individual contributions of important species between H and Ni. Because of the large Fe abundance at solar metallicity, its strong line blanketing power, and the significant contribution of the abundant H-rich material in the ejecta, Fe I and Fe II contribute considerably to the escaping SN radiation, primarily in the form of a forest of lines up to 1-2 μm, and with just a few strong forbidden lines at longer wavelength. Being relatively isolated, these infrared lines carry robust information on the ejecta composition and dynamics. All other elements in this model contribute a few lines, more or less scattered throughout the optical and infrared. For example, Ca contributes mostly with lines of Ca II in the optical, whereas Ni contributes both Ni I and Ni II lines throughout the optical and infrared.
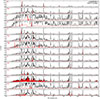 |
Fig. A.2. Breakup of species contributions to the total flux in model s15p2 at 300 d. We show a stack of synthetic spectra and shade in red the flux contribution from important species (see label at top-left in each panel; this contribution also includes the continuum flux). We show the flux Fν (in mJy) versus wavelength (in microns) for better visibility (the infrared is typically a hundred times fainter than the optical) and adopting the SN 2024ggi distance. In each row, we adjust the ordinate range in order to encompass the strongest line from the selected species. |
A.3. Profile morphology of a sample of optical and infrared lines
Figures A.3 and A.4 illustrate the profile morphology of a variety of lines from H, O, Ne, Mg, Ar, Ca, Ni, and Co for both epochs of observations of SN 2024ggi and for model s15p2 at 275 d and 400 d (the setup is the same as in Figs. 1 and 2). Here, only a distance scaling is applied to the model (with an additional factor of 0.75), indicating a satisfactory match to the observations across the whole wavelength range as well as for most lines. An exception is, for example, the observed double-peak emission of [Ni I] 3.119 μm (see also discussion in Hueichapán et al. 2025) whereas the model yields an emission with a central peak. However, this unlikely reflects the complete distribution of Ni since the [Ni II] 1.939 μm line has a different profile, this time well matched by the model. The different morphology of [Ni I] and [Ni II] lines indicates the presence of Ni-rich regions of different ionization, likely related to differences in density.
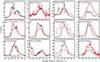 |
Fig. A.3. Same as Fig. 1 but comparing the flux in individual emission lines versus Doppler velocity for the first epoch of observations of SN 2024ggi with the s15p2 model at 275 d. The x-axis origin corresponds to the line rest wavelength but because of line overlap (in the model) or asymmetry (only in the observations since the model is 1D), the emission may be skewed. The fluxes are shown as Fν, which yields a comparable flux level of a few mJy for all strong lines across the optical and infrared at the SN distance. Lines are ordered from top to bottom and left to right in order of increasing wavelength. |
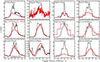 |
Fig. A.4. Counterpart to Fig. A.3 but for the second epoch of observations of SN 2024ggi and the model at 400 d, as shown versus wavelength in Fig. 2. |
Appendix B: Observational datasets
We obtained two epochs of longslit spectroscopy of SN 2024ggi on 26 January and 1 June 2025 and with the Keck Observatory LRIS (Oke et al. 1995). We used the 400/3400 grating for blue exposures and the 400/8500 grating for the red exposures, both with a 1.0” slit mask. For all of these spectroscopic observations (see summary in Table B.1), standard CCD processing and spectrum extraction were accomplished with LPipe (Perley 2019). The near-infrared spectra were obtained with the R ∼ 2700 NIRES (Wilson et al. 2004)) located on Keck-II on UT 15 January and 15 May 2025. For both observations we exposed for 1200 s total divided into 4 × 300 s individual exposures, dithering along the slit to allow for better sky subtraction. The data were reduced using a custom version of the IDL based reduction package Spextool (Cushing et al. 2004) modified for use with NIRES. We used xtellcor (Vacca et al. 2003) to correct for telluric features in our spectrum using an A0 standard star observed close in airmass and time to our target. For the spectrum obtained on 12 January 2025 we used HIP54427 and on 15 May 2025 we used HIP56308 for the telluric correction.
Optical and near-infrared spectroscopic observations of SN 2024ggi.
We observed SN 2024ggi on 1 January 2025 and 5 May 2025 corresponding to epochs of about +266 and +390 d with the MIRI low-resolution (LRS) instrument on JWST that covers 5–14 μm with a resolving power (R = λ/Δλ) of ∼ 40–160 (programme Id # 6678, PI Kotak). The target was nodded along the slit to facilitate the removal of background and other detector systematics. The instrument configurations are listed in Table B.2; we used three integrations of 50 and 100 groups, respectively for the first and second epochs. In order to focus on particular spectral lines of interest, we also obtained medium resolution (MRS) spectra at the same epochs, using the SHORT grating settings for each of the 4 channels covering 4.90−5.74, 7.51−8.77, 11.55−13.47, and 17.70−20.95 μm with R ∼ 3500 − 1700 across this range. Given the brightness of the target, we proceeded with the Stage 3 products generated by v1.17.1 of the JWST pipeline (Bushouse et al. 2025) using the jwst_1321.pmap Calibration Reference Data System (CRDS). However, we performed crosschecks starting with the uncalibrated frames and using v1.18.0 with jwst_1364.pmap, and found the differences to be minimal. The resulting spectra, combined with the ground-based optical and near-infrared data described above, are shown in Fig. B.1. The dataset used here was augmented with near contemporaneous NIRSPEC observations (programme Id # 6716, PI Ashall).
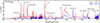 |
Fig. B.1. Keck-LRIS optical, Keck-NIRES near-infrared, and JWST infrared spectroscopic observations of SN 2024ggi obtained at about 275 and 400 d after explosion. The data have been corrected for redshift. |
MIRI observations of SN 2024ggi.
All Tables
All Figures
|
Fig. 1. Comparison between the optical-to-infrared spectroscopic observations of SN 2024ggi at 266–291 d (red; see Appendix B) with model s15p2 interpolated to the same epoch and scaled by a factor of 0.75 (black). Each panel covers the optical, near-infrared, and mid-infrared ranges (top to bottom). The data were corrected for redshift and reddening, and the model was scaled to the SN distance. The flux shift corresponding to the same model but at ±30 d is shown in light/dark gray. The labels indicate the main emission features. To facilitate comparison, the flux from the radiative-transfer model was augmented by a composite blackbody spectrum, which may arise from molecular emission (dashed; the blackbody temperatures and radii are 1230/400 K and 0.8/5.0 × 1015 cm). The region between 8 and 10 μm, which appears featureless with only weak SiO emission, is shown in Fig. B.1. |
| In the text | |
|
Fig. 2. Same as Fig. 1, but now for the observations of SN 2024ggi at about 400 d and the contemporaneous model s15p2. |
| In the text | |
|
Fig. 3. Fractional luminosity integrated from 0.3 to 21 μm for the first epoch of observations of SN 2024ggi and model s15p2 at 275 d. The data were corrected for redshift and reddening. A linear interpolation is used to infer the flux in regions without data. |
| In the text | |
|
Fig. 4. Mass of the O-rich shell (black) and the C/O-rich shell (red) in the explosion models of Sukhbold et al. (2016) with a zero-age main-sequence mass (MZAMS) in the range 9.0–26.5 M⊙. The inset zooms in on the lower-mass progenitors and their very low metal yields. |
| In the text | |
|
Fig. A.1. Evolution of the percentage fraction of the bolometric flux that is radiated in [Ar II] 6.983 μm (left), [Ne II] 12.810 μm (middle), and [O I] 0.632 μm (right) for a sample of core-collapse SN models from Dessart (2025a). |
| In the text | |
|
Fig. A.2. Breakup of species contributions to the total flux in model s15p2 at 300 d. We show a stack of synthetic spectra and shade in red the flux contribution from important species (see label at top-left in each panel; this contribution also includes the continuum flux). We show the flux Fν (in mJy) versus wavelength (in microns) for better visibility (the infrared is typically a hundred times fainter than the optical) and adopting the SN 2024ggi distance. In each row, we adjust the ordinate range in order to encompass the strongest line from the selected species. |
| In the text | |
|
Fig. A.3. Same as Fig. 1 but comparing the flux in individual emission lines versus Doppler velocity for the first epoch of observations of SN 2024ggi with the s15p2 model at 275 d. The x-axis origin corresponds to the line rest wavelength but because of line overlap (in the model) or asymmetry (only in the observations since the model is 1D), the emission may be skewed. The fluxes are shown as Fν, which yields a comparable flux level of a few mJy for all strong lines across the optical and infrared at the SN distance. Lines are ordered from top to bottom and left to right in order of increasing wavelength. |
| In the text | |
|
Fig. A.4. Counterpart to Fig. A.3 but for the second epoch of observations of SN 2024ggi and the model at 400 d, as shown versus wavelength in Fig. 2. |
| In the text | |
|
Fig. B.1. Keck-LRIS optical, Keck-NIRES near-infrared, and JWST infrared spectroscopic observations of SN 2024ggi obtained at about 275 and 400 d after explosion. The data have been corrected for redshift. |
| In the text | |
Current usage metrics show cumulative count of Article Views (full-text article views including HTML views, PDF and ePub downloads, according to the available data) and Abstracts Views on Vision4Press platform.
Data correspond to usage on the plateform after 2015. The current usage metrics is available 48-96 hours after online publication and is updated daily on week days.
Initial download of the metrics may take a while.