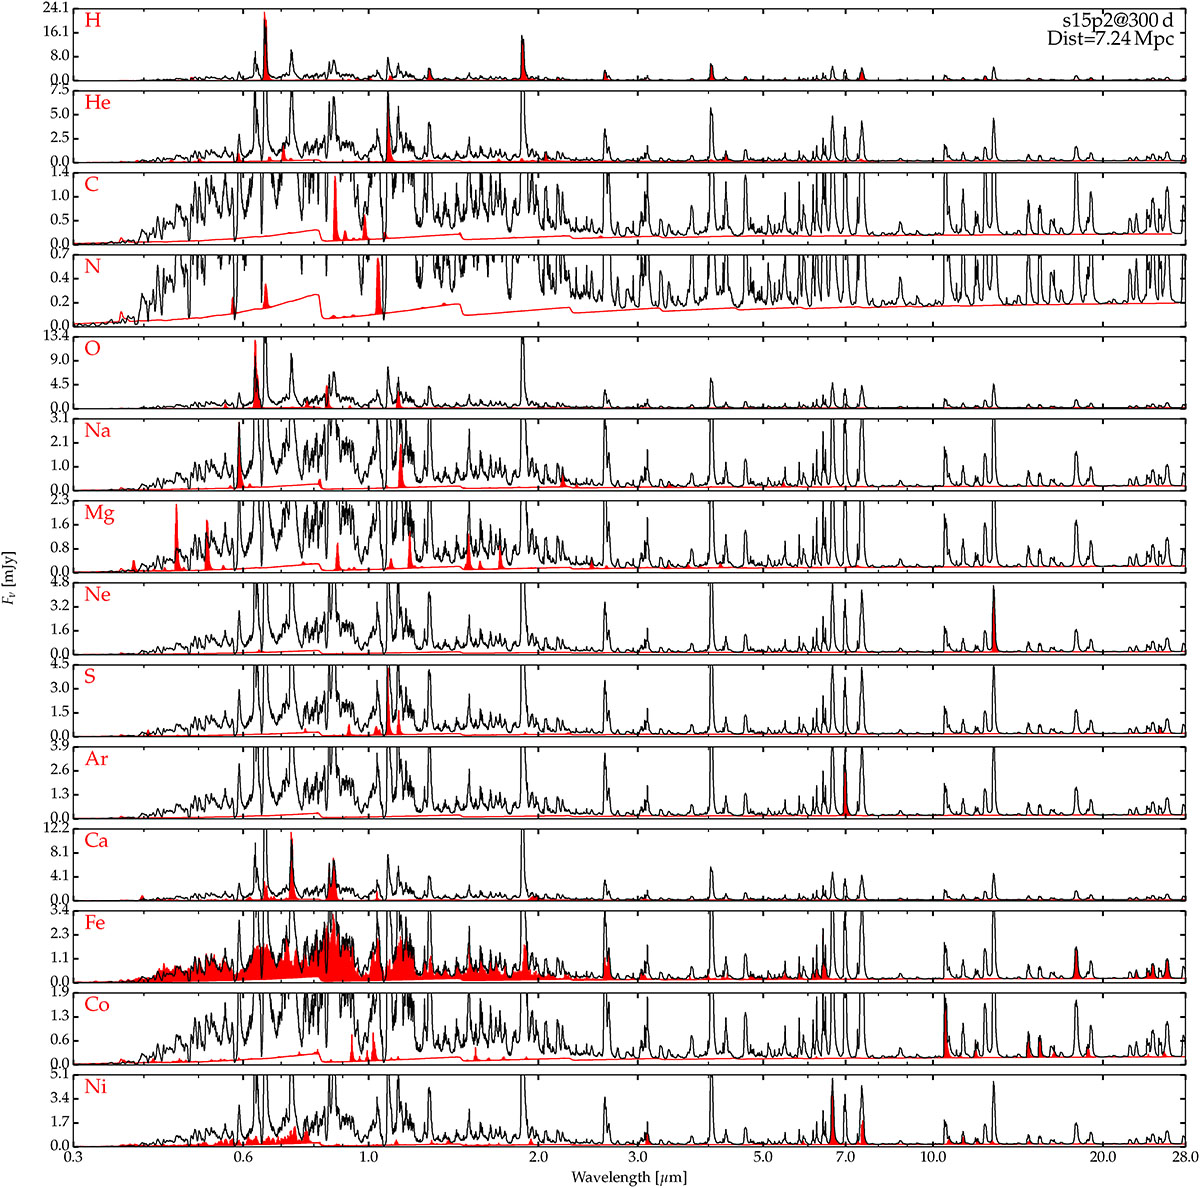
Fig. A.2.
Download original image
Breakup of species contributions to the total flux in model s15p2 at 300 d. We show a stack of synthetic spectra and shade in red the flux contribution from important species (see label at top-left in each panel; this contribution also includes the continuum flux). We show the flux Fν (in mJy) versus wavelength (in microns) for better visibility (the infrared is typically a hundred times fainter than the optical) and adopting the SN 2024ggi distance. In each row, we adjust the ordinate range in order to encompass the strongest line from the selected species.
Current usage metrics show cumulative count of Article Views (full-text article views including HTML views, PDF and ePub downloads, according to the available data) and Abstracts Views on Vision4Press platform.
Data correspond to usage on the plateform after 2015. The current usage metrics is available 48-96 hours after online publication and is updated daily on week days.
Initial download of the metrics may take a while.