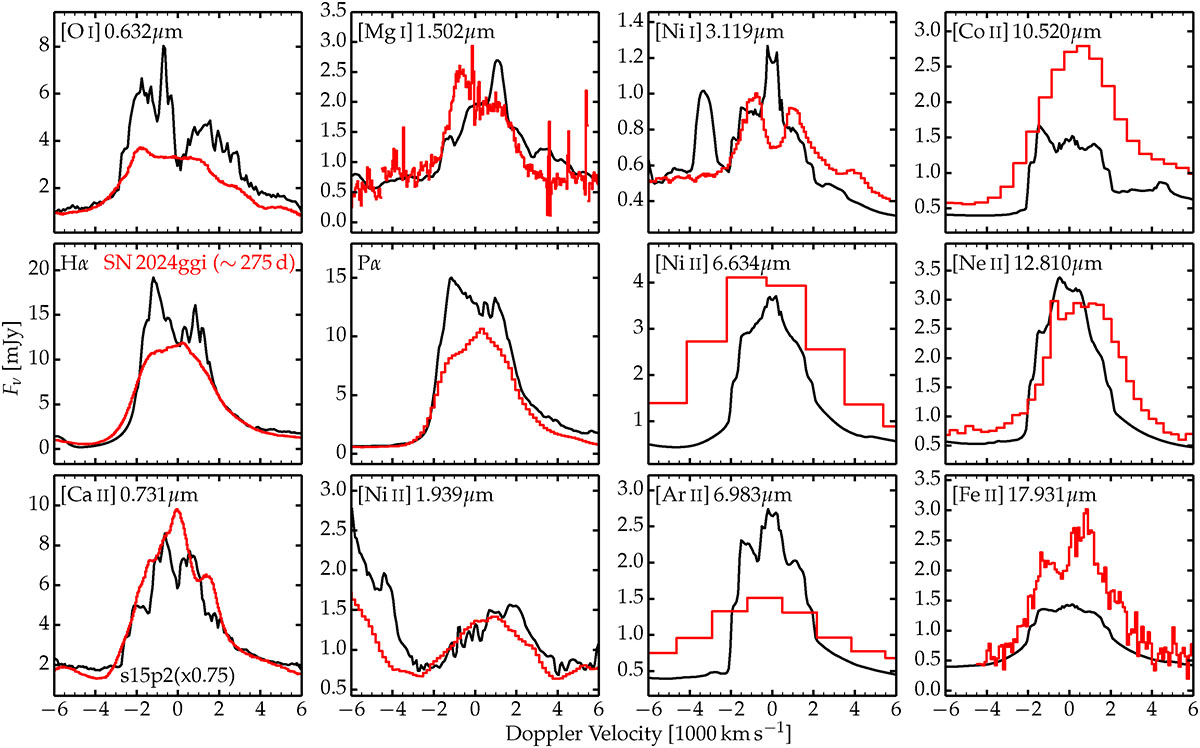
Fig. A.3.
Download original image
Same as Fig. 1 but comparing the flux in individual emission lines versus Doppler velocity for the first epoch of observations of SN 2024ggi with the s15p2 model at 275 d. The x-axis origin corresponds to the line rest wavelength but because of line overlap (in the model) or asymmetry (only in the observations since the model is 1D), the emission may be skewed. The fluxes are shown as Fν, which yields a comparable flux level of a few mJy for all strong lines across the optical and infrared at the SN distance. Lines are ordered from top to bottom and left to right in order of increasing wavelength.
Current usage metrics show cumulative count of Article Views (full-text article views including HTML views, PDF and ePub downloads, according to the available data) and Abstracts Views on Vision4Press platform.
Data correspond to usage on the plateform after 2015. The current usage metrics is available 48-96 hours after online publication and is updated daily on week days.
Initial download of the metrics may take a while.