| Issue |
A&A
Volume 704, December 2025
|
|
|---|---|---|
| Article Number | A270 | |
| Number of page(s) | 21 | |
| Section | Extragalactic astronomy | |
| DOI | https://doi.org/10.1051/0004-6361/202556544 | |
| Published online | 15 December 2025 | |
Deciphering the radio-star formation correlation on kpc scales
IV. Radio halos of highly inclined spiral galaxies in the Virgo cluster
1
Université de Strasbourg, CNRS, Observatoire Astronomique de Strasbourg, UMR 7550, 67000 Strasbourg, France
2
Astronomical Observatory, Jagiellonian University, ul. Orla 171, 30-244 Kraków, Poland
3
Hamburg University, Hamburger Sternwarte, Gojenbergsweg 112, 21029 Hamburg, Germany
★ Corresponding author: This email address is being protected from spambots. You need JavaScript enabled to view it.
Received:
22
July
2025
Accepted:
1
October
2025
Abstract
In addition to the radio continuum emission of the thin galactic disk, vertically extended emission is ubiquitous in star-forming disk galaxies. This halo emission can represent an important fraction of the total emission of the galaxy. The cosmic-ray electrons (CRe) that cause the radio continuum emission are produced within the thin disk and are transported into the halo. They might interact with the warm neutral and ionized medium, which is also present in the halo region. We made an attempt to reconstruct the radial properties of radio continuum halos in nearly edge-on galaxies, in which the star formation rate (SFR) distribution can be deprojected and the vertical radio continuum emission is clearly distinct from the disk emission. The deprojected SFR distribution was convolved with a Gaussian kernel to take CRe diffusion within the galactic disk into account, and a vertical profile of the radio continuum emissivity was added to the disk emission. The three-dimensional emission distribution was then projected on the sky and was compared to VLA radio continuum observations at 20 and 6 cm. We found that the halo emission overall contains information on the underlying distribution of the SFR. The majority of our galaxies show flaring radio continuum halos. Except for one galaxy, our Virgo galaxies follow the trend of an increasing effective height with increasing radio continuum size, as reported by the CHANG-ES collaboration. We confirm that radio continuum halos can represent a significant fraction of the total radio continuum emission of a star-forming spiral galaxy. At 20 cm and 6 cm, between 30 and 70% of the total radio continuum emission originates in the halo. We propose a halo classification based on the height ratio and SI between 20 and 6 cm. When we interpret the vertical structures of the large-scale magnetic field within the disk-halo and the halo types as a sign of a galactic outflow or wind, all galaxies except one most probably harbor an advection-dominated halo.
Key words: galaxies: ISM / galaxies: magnetic fields
© The Authors 2025
 Open Access article, published by EDP Sciences, under the terms of the Creative Commons Attribution License (https://creativecommons.org/licenses/by/4.0), which permits unrestricted use, distribution, and reproduction in any medium, provided the original work is properly cited.
This article is published in open access under the Subscribe to Open model. This email address is being protected from spambots. You need JavaScript enabled to view it. to support open access publication.
1. Introduction
The vertical scale heights of the different phases of the interstellar medium (ISM) in the Galaxy vary between ∼70 pc for the molecular gas, ∼140 pc for the cold neutral medium, and ∼400 pc for the warm neutral medium (Boulares & Cox 1990). In addition, the warm ionized medium (WIM) or diffuse ionized gas (DIG) extends to a height of ∼1 kpc (e.g., Haffner et al. 2009). Beyond the Galaxy, similar distributions of the DIG have been observed in many nearby disk galaxies (e.g., Dettmar 1990; Rand et al. 1990 Zurita et al. 2000; Levy et al. 2019). Diffuse radio continuum emission, which is generally associated with the high-latitude WIM (Krause et al. 2018), is called a radio continuum halo. The mechanism of the radio continuum emission is synchrotron emission that stemms from cosmic-ray (CR) electrons that interact with the magnetic field of a galaxy. Cosmic-ray particles are mainly produced in supernova shocks via Fermi acceleration. The relativistic electrons do not stay at the location of their creation, however. They propagate either via diffusion or by streaming with the Alfvén velocity. In addition, CRe can be transported into the halo by advection, that is, a galactic wind or outflow. The Continuum Halos in Nearby Galaxies – an EVLA1 Survey (CHANG-ES) project (Irwin et al. 2012) showed that for star-forming disk galaxies, the vertical transport of CR electrons is mostly caused by advection (Heesen 2021; Irwin et al. 2024): Only 2 out of 11 analyzed CHANG-ES galaxies showed a diffusion-dominated radio halo. The best-known discriminator thus far is the surface density of the star formation rate. Galaxies at low star formation rate (SFR) surface densities have diffusive halos. The heights of the radio halos are set by either diffusion and advection together with CR electron escape or by synchrotron losses. The typical scale height of radio continuum halos is about 1 kpc (Krause et al. 2018), which is very close to that of the WIM.
The CHANG-ES collaboration studied the radio continuum halos of edge-on galaxies (i = 76–90°) by fitting Gaussians and exponential functions to the vertical profiles of the radio continuum emission at 6 (C band) and 20 cm (L band). The CHANG-ES project was described in Irwin et al. (2012), and details about the first data release were provided by Wiegert et al. (2015). In this work, we proceed by studying highly inclined galaxies (70° ≤i ≤ 78°) for which maps of the SFR surface density are available. Vollmer et al. (2020) predicted radio continuum maps by convolving the source map, represented by that of the SFR surface density, with Gaussian (diffusion) and exponential (streaming) kernels. Here, we add a vertical component to the predicted radio continuum maps that is anchored in the star-forming disk. We determine whether the halo radio continuum emission carries information on the underlying disk and if the radio continuum halo has a constant height or is flaring. Extending the CHANG-ES method, we use the spectral index (SI) of the halo emission to investigate whether a halo is dominated by (i) advection or diffusion and (ii) escape or synchrotron loss.
This article is structured in the following way: The radio continuum data and the data we used to calculate the star formation maps are presented in Sect. 2. Our analytical model for the 3D distribution of the radio continuum emissivity and its projection of the sky is explained in Sect. 3. The presentation of the results (Sect. 4) is followed by a classification of the radio halos (Sect. 5). We discuss our results in Sect. 6 and conclude in Sect. 7.
2. Data
The integrated SFR, the radio continuum flux at 4.85 GHz from Vollmer et al. (2013), and the stellar mass from Boselli et al. (2015) of each galaxy are presented in Table 1. The stellar masses range from 1.6 × 10⁹ M⊙ to 5.0 × 10¹⁰ M⊙, the SFR from 0.5 M⊙ yr−1 to 1.8 M⊙ yr−1.
Galaxy sample.
2.1. Radio continuum
For the radio continuum maps, we used published VLA data at 4.85 and 1.4 GHz at a resolution of 15–22″ for all galaxies. The Virgo spiral galaxies were observed at 4.85 GHz between October 12, 2009, and December 23, 2009, with the Very Large Array (VLA) of the National Radio Astronomy Observatory (NRAO) in the D-array configuration. The bandwidths were 2 × 50 MHz. The final cleaned maps were convolved to a beam size of 22″ × 22″ (Vollmer et al. 2013). In addition, we observed the galaxies at 1.4 GHz on March 21, 2008, in the C-array configuration. The bandwidths were 2 × 50 MHz. The final cleaned maps were convolved to a beam size of 22″ × 22″ (Vollmer et al. 2013). At a distance of 17 Mpc, 1″ corresponds to 82 pc. Furthermore, we used the C-band D-array and L-band C-array data from CHANG-ES (Irwin et al. 2012). The C-band and L-band images of our galaxy sample are presented in Figs. A.1 and A.2. We used the 1.4 GHz data of NGC 4294 from VIVA (Chung et al. 2009) because these data significantly improved the model results.
For our analysis, we subtracted the thermal free-free radio emission according to the recipe of Murphy et al. (2008),
 (1)
(1)
where T is the electron temperature, and Iν(24 μm) is the flux density at a wavelength of 24 μm. We note that there are other alternative methods to account for the thermal free-free emission using, for example, the extinction-corrected Hα emission (Tabatabaei et al. 2007, Heesen et al. 2014). Since information on the spatially resolved Hβ lines was not available to us, we were unable to calculate the extinction correction of the Hα emission based on the Balmer decrement.
2.2. Star formation rate
The SFR surface density was calculated from the FUV luminosities corrected by the total infrared to far-ultraviolet (FUV) luminosity ratio (Hao et al. 2011). This method takes the UV photons from young massive stars into account that escape the galaxy, and those that are absorbed by dust and are reradiated in the far-infrared,
 (2)
(2)
where I(FUV) is the GALEX far ultraviolet, and I(TIR) is the total infrared intensity based on Spitzer IRAC and MIPS data in units of MJy sr−1.  is in units of M⊙ kpc−2 yr−1. This prescription only holds for a constant SFR surface density over the last few 100 Myr.
The deprojected star formation maps of our galaxy sample are presented in Fig. B.1. The deprojection is not unique, and our deprojected maps therefore do not look like typical face-on galaxies: The spiral structures are patchy, and the overall disk structure is more oval than round (especially for NGC 4419). Nevertheless, given the simplicity of our halo model, we are confident that the quality of our simple deprojection is good enough to constrain the major halo properties, that is, its dependence on the morphology of the underlying star-forming disk, the radial profile of the halo height, and the halo flux fraction.
3. Method
As in Vollmer et al. (2020), we convolved the star formation maps of the six highly inclined galaxies with adaptive Gaussian smoothing kernels in two dimensions to obtain model radio continuum emission maps. These authors showed that the smoothing length scales depend on the observation frequency. For simplicity and in line with the results of Vollmer et al. (2020), we used a constant smoothing length scale of 2.0 kpc at 20 cm and 1.3 kpc at 6 cm. We did not vary these scale lengths because the models with different halo types were quite time-consuming.
When the radio halo is dominated by diffusion, a Gaussian vertical profile is expected, and when the halo is dominated by advection, an exponential halo profile is expected. A thin and a thick disk give rise to two Gaussians or exponentials. We also used the empirical function of Oosterloo et al. (2007), which they fit to the H I halo of NGC 891. For most of the models, the height depends of the galactic radius R, but it might also depend on the local SFR surface density  . The specific intensity Iν depends on
  in most of the models, but it may also depend on R. We also allowed for a small offset o of the vertical profiles. In this way, we corrected for possible small errors of the position angle and warps of the galactic disk. In general, the offset was found to be o ≲ 300 pc.
In total, we used ten different halo prescriptions (Table 2). It is expected that the CRe follow the vertical halo magnetic field when they leave the thin galactic disk. By applying our vertical halo profiles, we implicitly assumed that the halo magnetic fields are vertical without any bending (see Heald et al. 2022, for a more sophisticated model). For the production of the model radio continuum map, the following steps were performed: (i) We inserted the SFR surface density map as the thin disk into a model cube, (ii) we convolved it with a Gaussian to generate the predicted radio continuum map of the thin disk, (iii) we added the halo, (iv) we projected it according to the inclination and position angle of the galaxy, and (v) we convolved it with a Gaussian to obtain the spatial resolution of the observations. Our models have up to 12 variables that were determined by fitting the model to the radio continuum map. For each model, the reduced  was calculated using the rms of the radio continuum map, where fobs and fmodel are the observed and model flux densities, respectively.
Prescriptions for the radio continuum halo.
To fit the models to the data, we performed a multidimensional minimization using the downhill simplex method (Nelder & Mead 1965). The IDL routine amoeba (Press et al. 1992) was used for this purpose. We confirmed for a very limited number of cases that different initial conditions lead to the same results. We cannot exclude that a local minimum was found by amoeba, however. All models converged to the presented solutions. The emission of the four quadrants of the radio continuum maps were fit separately. Since NGC 4192 harbors a strong central point source associate with an active galactic nucleus, the model was not fit to the data in a band around the center (Fig. 1). Each model needed about two days on a single CPU to converge.
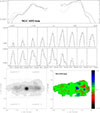 |
Fig. 1. Radio continuum halo model of NGC 4192. Upper panel: Profiles along the minor and major axes. The solid lines show observations, the dashed lines show the model including a a thin disk and a halo, and the dotted lines show the model with only a thin disk. All distance are in arcseconds. Lower left panel: Locations of the slices along the major and minor axis. Lower right panel: Maps of the model residuals in units of the rms. |
We realized that for the models for which we tried to fit the thin disk with a separate profile (gauss, gaussinh, exp, and expsinh in Table 2), the fluxes were sometimes distributed between the two profiles in an arbitrary way. Therefore, we did not use the scale heights h, h1, and h2, but determined an effective halo height H. For each galactic radius R, we calculated H with
 (3)
(3)
where zmax = 8.2 kpc. For NGC 4178, we realized that the fitting procedure led to much larger or smaller effective heights than the mean height. We thus decided to discard these solutions by applying resistant_mean in IDL to identify the outlying solutions. These are marked with parentheses in Table C.1.
The final radial profile of H were calculated (i) with all ten models and (ii) with the four best-fitting models. Furthermore, we calculated the thin disk and halo flux fraction for each model to determine the spectral index (SI) of the halo emission.
Our rather time-consuming model calculations did not permit a proper estimation of the uncertainties of the different parameters via Markov chain Monte Carlo (MCMC) techniques. Instead, we investigated the parameter with the strongest effect on the reduced χ2. We did this by decreasing and increasing each parameter separately by 50% for the NGC 4192 models at 6 cm. We then identified the parameters that increased the reduced χ2 by at least a factor of two. As expected, the reduced χ2 is sensitive to the exponents of the radius in the descriptions of the height and the vertical offset. In addition, the constant of the vertical offset and the exponent of the SFR surface density also affect the reduced χ2 significantly. We conclude that all exponents in the prescriptions of Table 2 are well constrained.
4. Results
We found 10 ≲ χ2 ≲ 50 for most of the models of NGC 4178, NGC 4192, NGC 4294, and NGC 4808 (Tables C.1, C.2, C.4, and C.7). For NGC 4192CHANG-ES, the range is 10 ≲ χ2 ≲ 100 (Table C.3), for NGC 4419, it is 100 ≲ χ2 ≲ 800 (Table C.5), and for NGC 4532, it is 30 ≲ χ2 ≲ 400 (Table C.6). Thus, the models reproduce the radio emission distribution of NGC 4419 and NGC 4532 significantly less well than that of the other galaxies. We note that the reduced χ2 of the smoothing experiments of Vollmer et al. (2020) were on the same order.
When we compared the three models with the lowest χ2 at the two wavelengths for a given quadrant in a given galaxy, we found no preferences for a Gaussian (diffusion) or exponential (advection) vertical profile (Tables C.1–C.7). As for the transport of CRe within the galactic disk studied by Vollmer et al. (2020), it is not possible to distinguish between diffusion- and advection-dominated radio continuum halos solely based on the type of the vertical intensity profile.
The vertical profiles, which exclusively depend on the galactic radius R (onegausssmooth and oneexpsmooth; Table 2), are very rarely found among the three models with the lowest χ2 (Tables C.1–C.7). When this is the case, it is found at one wavelength, but not in the other. We thus conclude that overall, the halo emission contains information on the underlying distribution of the SFR surface density ( ).
).
The surface brightness profiles along the major axis and along lines parallel to the minor axis for NGC 4192 based on our and the CHANG-ES 20 cm and 6 cm data together with the residual maps are shown in Figs. 1 and C.1. The best-fit models were selected separately in all four quadrants.
As expected, we found consistent overall results for the CHANG-ES and our data. The details of the residual maps are different, however. For example, the negative residuals in the eastern half of the galactic disk based on the CHANG-ES data are absent from the residual maps based on our data. Halo radio continuum emission is clearly detected in all quadrants (dashed lines, which correspond to models with halo emission, compared to the dotted lines, which correspond to models without halo emission). The halo emission also improves the profile along the major axis. The halo emission is less prominent at 6 cm than at 20 cm. The residuals are higher on the western than on the eastern side of the galactic disk.
The radial profiles of the halo effective height H of NGC 4192 are presented in Fig. 2 for the four best models and in Fig. D.1 for all ten models. The height profiles derived from the CHANG-ES and our data agree well with each other. The radio halo emission of all quadrants is flaring. The western half of the disk is somewhat thicker than the eastern half at both wavelengths. Overall, the radially averaged halo heights and halo flux fractions based on the CHANG-ES and our data are consistent (Table 3). Our model procedure is thus robust.
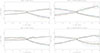 |
Fig. 2. Radial profiles of the halo scale height of NGC 4192. Upper panel: All ten models. Lower panel: Four best models. The models with a low χ2 are plotted in red, and the models with a high χ2 are shown in blue. |
Mean heights and flux fractions.
NGC 4178 is the only galaxies in our sample without detectable radio halo emission at 6 cm (Table 3 and Figs. 3 and D.2). The mean effective height is small (∼100 pc) at 6 cm. At 20 cm, the halo emission distribution has an effective height of ∼300 pc. NGC 4294 and NGC 4419 have relatively thin radio continuum halos (300–400 pc at both wavelengths). The halo flux fraction of NGC 4419 (f > 0.7) is significantly higher than that of NGC 4294 (f ∼ 0.5). In NGC 4419, we detect somewhat detached extended 6 cm emission at very low surface brightnesses that cannot be properly reproduced by our models (Figs. 3 and D.2). NGC 4532 has a thick (H ∼ 0.7 kpc at 6 cm and H ∼ 1.8 kpc at 20 cm) but not prominent radio continuum halo (f ∼ 0.3) at both wavelengths (Figs. 3 and D.2). NGC 4808 has the thickest and prominent radio continuum halo (H ∼ 0.8 kpc at 6 cm and H ∼ 2.0 kpc at 20 cm; Figs. 4 and D.3).
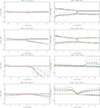 |
Fig. 3. Radial profiles of the halo scale height of NGC 4178, NGC 4294, NGC 4419, and NGC 4532. We show the four best models. The models with a low χ2 are plotted in red, and the models with a high χ2 are shown in blue. |
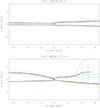 |
Fig. 4. Radial profiles of the halo scale height of NGC 4808. We show the four best models. The models with a low χ2 are plotted in red, and the models with a high χ2 are shown in blue. |
The majority of our galaxies show flaring radio continuum halos, which means that the effective height increases with galactic radius (Figs. 2–4 and Figs. D.1–D.3). In most of the cases, the radial profiles of the effective height behave differently in the four quadrants. There can be an east-west asymmetry (NGC 4178 and NGC 4192) or a north-south asymmetry (NGC 4532).
The radially averaged effective heights as a function of the size of the radio continuum disk for our highly inclined Virgo spiral galaxies are compared to those of the CHANG-ES galaxies in Fig. 5. Except for NGC 4178, our Virgo galaxies follow the trend of an increasing effective height with increasing radio continuum size that was found by the CHANG-ES collaboration (Krause et al. 2018). Moreover, the effective heights of NGC 4532 and NGC 4808 at 20 cm are significantly larger than expected from the correlation. As already stated before, a radio continuum halo is absent at 6 cm in NGC 4178, and it is very thin at 20 cm given its large radio continuum size.
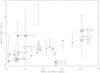 |
Fig. 5. Halo scale heights as function of the radio diameter. The triangles show CHANG-ES galaxies at 6 cm, the pluses show CHANG-ES galaxies at 20 cm, the boxes show Virgo galaxies at 6 cm, and the asterisks show Virgo galaxies at 20 cm. |
5. The classification of radio continuum halos
The vertical intensity profile of a radio continuum halo is determined by the transport model, which can be diffusion, streaming, or advection, and by the decrease in synchrotron emission, which can be due to synchrotron losses or CRe escape. The ratio rH of the effective halo heights at 6 and 20 cm and the SI of the halo are different for different types of halos. As stated by Krause et al. (2018), in a halo that is dominated by synchrotron energy loss, the outer halo boundary is determined as the location at which the CRe have lost their energy by a sufficient amount for its radiation to be below the observational detection limit. In an escape-dominated halo, the halo boundary is observed where the number of CRe and the magnetic field strength are too small and too weak to emit detectable radio emission. This also depends on the sensitivity of the observations. In practice, both processes can occur simultaneously along the line of sight.
We followed Krause et al. (2018) and Heesen (2021) for the height ratios. Based on the height ratio, a diffusion synchrotron loss-dominated halo cannot be distinguished from an advection escape-dominated halo (rH ∼ 1). We suggest to break this degeneracy by including the spectral index (SI) in the analysis: Whereas the SI for synchrotron losses is about −1.0, it is ∼ − 0.5 when escape-losses dominate the halo. Additional CRe aging was taken into account by a slight steepening of the radio continuum spectrum (SI decreased by −0.25). We found the following halo characteristics: (i) synchrotron loss-dominated with advection: rH ∼ 1.9, SI ∼ − 1.25; (ii) synchrotron loss-dominated with diffusion: rH ∼ 1.2, SI ∼ − 1.25; (iii) escape-dominated with diffusion: rH ∼ 1.1, SI ∼ − 0.75, and (iv) escape-dominated with advection: rH ∼ 1.1, SI ∼ − 0.75. The two escape-dominated halo types (iii) and (iv) are indistinguishable. It is expected that the preferred CRe transport mechanism for escape-dominated halos is advection by a galactic wind or outflow provided that the SFR surface density is equal to or higher than the average of star-forming galaxies. Since galaxies with lower SFR surface density (green valley galaxies) are rare, most of the escape-dominated halos are expected to be dominated by advection and not by diffusion. We arbitrarily draw circles around these points to delimit the different regions in the rH–SI diagram of Fig. 6. Cosmic-ray transport models for a synchrotron-loss dominated halo with diffusion and halos with advection calculated with SPINNAKER (Heesen et al. 2018) are consistent with our choice of the three regions in SI–h20/h6 space.
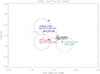 |
Fig. 6. CHANG-ES galaxies: Height ratio at 20 cm and 6 cm as a function of the spectral index between 20 cm and 6 cm. The triangles show SPINNAKER models of halos with advection. The diamond shows the SPINNAKER model of a halo that is dominated by synchrotron loss with diffusion. |
The CHANG-ES galaxies for which the height ratios and halo SI are measured are NGC 4013 (Stein et al. 2019a, NGC 4217 (Stein et al. 2020), and NGC 4666 (Stein et al. 2019b). Whereas diffusion is the CRe transport mechanism in NGC 4013 (Gaussian vertical profile), it is advection in the other two galaxies (exponential vertical profile). NGC 4013 lies within the region of diffusion synchrotron loss-dominated halos, whereas NGC 4217 and NGC 4666 lies at the edge of but still within the region of advection escape-dominated halos. This demonstrates that our halo classification based on rH and SI is meaningful.
The halo SI roughly follow the SI of the integrated emission. The mean deviation of the halo SI from the integrated SI is 0.12. As expected, most halo SIs (5 out of 7) are somewhat lower (steeper) than the integrated SI.
The corresponding halo classification for NGC 4192 is presented in Fig. 7 based on the CHANG-ES and our data for all ten models and the four best models. All results agree well with each other. The uncertainties are large, but they are not too large to permit the classification of the halo, which is advection escape-dominated in NGC 4192.
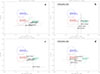 |
Fig. 7. NGC 4192. We show th height ratio as a function of the spectral index between 20 cm and 6 cm. Panels (a,b) show the mean of all ten models, and panels (c,d) show the mean of the four best-fit models. |
The radio halo of NGC 4294 is also most probably dominated by advection escape (Fig. 9). Only the third quadrant is consistent with being dominated by diffusion synchrotron escape. Because a vertical halo magnetic field was observed in this quadrant (Vollmer et al. 2013), the halo of this quadrant is probably also dominated by advection escape (see also Sect. 6).
For the other Virgo galaxies, the classification is less clear. When the halo height ratios of a given quadrant are very high, they are not shown in the corresponding rH–SI diagram. In NGC 4178, the height ratio in the second quadrant is ∼8 because of the large height at 20 cm. Whereas the halo of the third quadrant is dominated by advection escape, the conclusions for the first and fourth quadrants are less clear (Fig. 8). The halos of the latter quadrants are marginally consistent with being dominated by advection escape within the error bars.
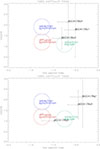 |
Fig. 8. NGC 4178. We show the height ratio as a function of the spectral index between 20 cm and 6 cm. Upper panel: Mean of all ten models. Lower panel: Mean of the four best-fit models. |
In NGC 4419, the halos of all four quadrants are broadly consistent with being dominated by advection escape (lower panel of Fig. 10). In NGC 4532, the radio continuum halos of all four quadrants are consistent with being dominated by advection escape or diffusion synchrotron loss, with a preference for the former (lower panel of Fig. 11). The halos of the first and second quadrants in NGC 4808 lie between the regions of advection escape and advection synchrotron dominance (lower panel of Fig. 12). The halo of the fourth quadrant is probably dominated by advection escape, whereas the classification of the halo in the third quadrant is uncertain. We conclude that overall, radio continuum halos that are dominated by advection escape prevail in our sample.
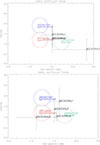 |
Fig. 9. NGC 4294. We show the height ratio as a function of the spectral index between 20 cm and 6 cm. Upper panel: Mean of all ten models. Lower panel: Mean of the four best-fit models. |
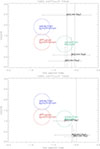 |
Fig. 10. NGC 4419. We show the height ratio as a function of the spectral index between 20 cm and 6 cm. Upper panel: Mean of all ten models. Lower panel: Mean of the four best-fit models. |
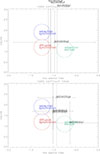 |
Fig. 11. NGC 4532. We show the height ratio as a function of the spectral index between 20 cm and 6 cm. Upper panel: Mean of all ten models. Lower panel: Mean of the four best-fit models. |
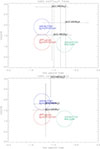 |
Fig. 12. NGC 4808. We show the height ratio as a function of the spectral index between 20 cm and 6 cm. Upper panel: Mean of all ten models. Lower panel: Mean of the four best-fit models. |
The mean height ratios as a function of the mean halo SI for our Virgo galaxies are shown in Fig. 6. Based on the mean values, the halos of NGC 4192, NGC 4294, and NGC 4419 are dominated by advection escape. Despite its large error bar for the height ratio, the halo of NGC 4178 is most probably dominated by advection/synchrotron escape. The halos of NGC 4532 and NGC 4808 have rather large error bars in both directions, which prevents us from classifying them based on the rH–SI diagram.
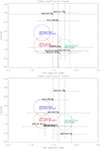 |
Fig. 13. Quantities averaged over all four quadrants: Height ratio at 20 cm and 6 cm as a function of the spectral index between 20 cm and 6 cm. Upper panel: Based on all ten models. Lower panel: Based on the four best-fit models. |
6. Discussion
Radio continuum halos represent a significant fraction of the total radio continuum emission of a star-forming spiral galaxy. At 20 cm and 6 cm, between 30 and 70% of the total radio continuum emission originates in the halo (Table 3; Stein et al. 2019b, 2020). The fraction is higher at low frequencies. This is in line with the results of the radio continuum model by Vollmer et al. (2022, 2025), where the effective height of the radio continuum emission is that of the gas disk (H) and not that of the star-forming disk (ldriv in their nomenclature).
All galaxies of our sample are located in the Virgo cluster (see Fig. 1 of Vollmer et al. 2013). NGC 4402 and NGC 4330 show strongly asymmetric radio continuum halos, where one side is compressed by ram pressure from the intercluster medium and the other side is linked to stripped material (Crowl et al. 2005; Vollmer et al. 2013). The radio continuum halos of NGC 4294, NGC 4532, and NGC 4808 show a lesser degree of asymmetry. None of three galaxies is deficient in H I (Chung et al. 2009). NGC 4294 is part of a galaxy pair and has an asymmetric outer H I distribution. NGC 4532 and NGC 4808 have extended asymmetric H I envelopes (Chung et al. 2009). The cluster environment therefore appears to cause strongly asymmetric radio continuum halos via ram pressure, whereas the local environment (galaxy pairs or external gas accretion) leads to rather weakly asymmetries of the halos.
The ratio of the radio luminosity and the SFR is normal for all galaxies except for NGC 4532, for which it is twice as high as the mean (Fig. 1 of Vollmer et al. 2020 and Table 1). On the other hand, the mean 6 cm surface brightness of NGC 4532 and NGC 4808 is about five times higher than that of NGC 4178. The mean 6 cm surface brightnesses of NGC 4192, NGC 4294, and NGC 4419 lie between these two extremes (Vollmer et al. 2013). We conclude that NGC 4532 and NGC 4808 most probably drive galactic winds and that their halos are caused by CRe advection.
The halo parameters were estimated best for large galaxies with a relatively high radio surface brightness (NGC 4192), which was expected. For the halos of the other galaxies, additional information from the large-scale magnetic field structure can be used that is derived from the polarized 6 cm radio continuum emission (Fig. D.4). The large-scale magnetic field configuration of a disk galaxy can be divided into three main types: (i) disk type, where the large-scale magnetic field is parallel to the disk plane, (ii) disk-halo type, which shows a characteristic X-structure, and (ii) halo type, where the large-scale magnetic field is perpendicular to the disk plane (see, e.g., Irwin et al. 2024).
The projected magnetic field lines are of disk-halo type in NGC 4192 and NGC 4419, of halo type in the southwestern disk of NGC 4294, of disk-halo and halo type in NGC 4532, and of halo type in NGC 4808. We interpret the vertical structures of the large-scale magnetic field within the disk-halo and halo types as a sign of a galactic outflow or wind. As expected, the two galaxies with the highest radio continuum surface brightnesses and thus SFR surface density show clear signs of galactic winds. These outflows lead to an enhanced radio continuum emission with respect to the SFR only in NGC 4532, which has the highest specific SFR of our galaxy sample (sSFR = 8.2 × 10⁻¹⁰ yr−1) and might be qualified as a starburst. Thus, all galaxies except for NGC 4178 are expected to harbor an advection-dominated halo. This means in turn that our estimate of the SI is more robust than that of the height ratio (see Sect. 5).
All halos of our highly inclined galaxy sample contain information on the underlying star formation distribution within the galactic disk (see Sect. 4). This is expected in an advection-dominated halo, where the CRe are transported into the halo by a galactic wind or outflow. As for the CHANG-ES sample, our galaxy sample is also dominated by radio continuum halos that are dominated by advection escape.
The particularly thin radio disk or halo of NGC 4178 (Fig. 5) is remarkable. Vollmer et al. (2013) did not detect any polarized 6 cm radio emission in this galaxy. This thinness calls for an explanation. Another Virgo galaxy in the sample of Vollmer et al. (2013) is NGC 4216. It has the lowest 6 cm mean surface brightness of the sample, a factor of 2.5 lower than that of NGC 4192 and a factor of 1.7 lower than that of NGC 4178. Whereas NGC 4216 is strongly H I deficient, NGC 4178 is not. In addition, NGC 4178 has a normal specific SFR of sSFR = 2 × 10⁻¹⁰ yr−1. The radio-thinness is not due to a diffusion synchrotron loss-dominated halo because the ratio of the 6 cm vertical height and diameter is about the same for NGC 4013, whose halo is dominated by diffusion synchrotron loss, and NGC 4217, whose halo is dominated by advection escape. It thus appears that radio-thinness only correlates with the mean 6 cm surface brightness and the lack of significant polarized radio continuum emission. We can only speculate that NGC 4216 and NGC 4178 lack a strong halo magnetic field. In this case, the halo is probably dominated by diffusion escape because the SFR surface density is lower than the average SFR surface density of star-forming galaxies in both galaxies.
We connected our flaring radio continuum disks to galactic H I an extended diffuse ionized gas (eDIG) disks. The H I radial profiles appear to have a typical shape. The flaring increases linearly with radius, where the stellar disk dominates the local gravitational potential, and it steepens into an exponential profile in the outer disk, where the potential is probably dominated by the halo (O’Brien et al. 2010). Our radio continuum halos reside within the optical disk, where stellar disk dominates the local gravitational potential. The inner parts of the thick halos might be qualified as linearly flaring, but most of them flatten at larger radii. The latter behavior is contrary to that of the H I disk. We thus conclude that the exponential vertical H I profile at large galactic radii has a different cause than that of the flattening vertical radio continuum profile. Whereas the latter is caused by star formation and CRe transport, the former is most probably caused by external gas accretion.
Lu et al. (2023) found for warm ionized gas that the eDIG scale height of 22 nearby edge-on spiral galaxies was comparable to that at 20 cm. In addition, the eDIG was slightly more extended than the neutral gas. They did not measure radial profiles of the Hα scale height, however. It will be interesting to compare the vertical profiles at large galactic radii of the three different gas phases. Clustered star formation might be a key ingredient to explain the multiphase nature of the halo gas. The injection spectrum of CRe and CRp of the model of Vollmer et al. (2025), which is needed to explain the integrated radio continuum emission of local and high-z main-sequence and starburst galaxies, is that expected for superbubbles created by multiple SN remnants (Vieu et al. 2022). Multiple holes, bubbles, worms (Heiles 1984), and chimneys created by the explosions of multiple clustered SN allow the CRe to travel into the halo region. At the same time, the illuminated walls of these structures constitute the warm ionized medium or DIG. This scenario was proposed by Koo et al. (1992) and is corroborated by more recent work, for example, Belfiore et al. (2022).
7. Conclusions
The vertically extended component of the diffuse radio continuum can represent an important fraction of the total radio continuum emission of a star-forming galaxy. The characteristics of radio continuum halos are traditionally measured in edge-on galaxies (Krause et al. 2018). These measurements are limited by the projection of the vertical emission distribution and by the assumption of a constant halo scale height. We reconstructed the radial properties of radio continuum halos in nearly edge-on galaxies (70° ≤i ≤ 78°), where the SFR surface density distribution can still be deprojected and the vertical radio continuum emission is still clearly distinct from the disk emission. The deprojected SFR surface density distribution was convolved with a Gaussian kernel to take CRe diffusion within the galactic disk into account, and a vertical profile of the radio continuum emissivity (Table 2) was added to the disk emission. The three-dimensional emission distribution was then projected on the sky and compared to VLA radio continuum observations at 20 and 6 cm (Vollmer et al. 2013). We also used publicly available VLA data from the CHANG-ES project (Irwin et al. 2012). The comparison was made separately in the four quadrants of the radio continuum images. Our results are based on the ten and four model with the lowest χ2. Based on the detailed comparison, we conclude that
-
our method is robust because of the consistent overall results for the CHANG-ES and our data of NGC 4192;
-
overall, the halo emission contains information on the underlying distribution of the SFR surface density;
-
the majority of our galaxies show flaring radio continuum halos;
-
except for NGC 4178, our Virgo galaxies follow the trend of increasing effective height with increasing radio continuum size found by the CHANG-ES collaboration (Krause et al. 2018);
-
radio continuum halos can represent a significant fraction of the total radio continuum emission of a star-forming spiral galaxy. At 20 cm and 6 cm, between 30 and 70% of the total radio continuum emission originates in the halo (Table 3; Stein et al. 2019a, 2020);
-
a halo classification based on the height ratio and SI between 20 and 6 cm is proposed;
-
when we interpret the vertical structures of the large-scale magnetic field within the disk-halo and halo types as a sign of a galactic outflow or wind, all galaxies except for NGC 4178 most probably harbor an advection-dominated halo.
The exponential vertical H I profile at large galactic radii has a different cause than the flattening vertical radio continuum profile. Whereas the latter is caused by star formation and CRe transport, the former is most probably caused by external gas accretion. Clustered star formation might be a key ingredient to explain the multiphase nature of the halo gas. Multiple holes, bubbles, worms (Heiles 1984), and chimneys created by the explosions of multiple clustered SN allow the CRe to travel into the halo region. At the same time, the illuminated walls of these structures constitute the warm ionized medium or DIG. It will be interesting to compare the radial profiles of the energy densities of the warm neutral gas (H I), the diffuse ionized gas or warm ionized medium, and the cosmic rays to investigate if and where the CRe can drive a galactic wind or outflow.
Data availability
Appendix C can be found on Zenodo (https://doi.org/10.5281/zenodo.14264986).
Acknowledgments
We would like to thank the CHANG-ES collaboration for providing the VLA data of NGC 4192.
References
- Belfiore, F., Santoro, F., Groves, B., et al. 2022, A&A, 659, A26 [NASA ADS] [CrossRef] [EDP Sciences] [Google Scholar]
- Boselli, A., Fossati, M., Gavazzi, G., et al. 2015, A&A, 579, A102 [NASA ADS] [CrossRef] [EDP Sciences] [Google Scholar]
- Boulares, A., & Cox, D. P. 1990, ApJ, 365, 544 [NASA ADS] [CrossRef] [Google Scholar]
- Chung, A., van Gorkom, J. H., Kenney, J. D. P., et al. 2009, AJ, 138, 1741 [NASA ADS] [CrossRef] [Google Scholar]
- Crowl, H. H., Kenney, J. D. P., van Gorkom, J. H., et al. 2005, AJ, 130, 65 [NASA ADS] [CrossRef] [Google Scholar]
- Dettmar, R.-J. 1990, A&A, 232, L15 [Google Scholar]
- Haffner, L. M., Dettmar, R.-J., Beckman, J. E., et al. 2009, Rev. Mod. Phys., 81, 969 [CrossRef] [Google Scholar]
- Hao, C.-N., Kennicutt, R. C., Johnson, B. D., et al. 2011, ApJ, 741, 124 [Google Scholar]
- Heald, G. H., Heesen, V., Sridhar, S. S., et al. 2022, MNRAS, 509, 658 [Google Scholar]
- Heesen, V. 2021, Ap&SS, 366, 117 [NASA ADS] [CrossRef] [Google Scholar]
- Heesen, V., Brinks, E., Leroy, A. K., et al. 2014, AJ, 147, 103 [NASA ADS] [CrossRef] [Google Scholar]
- Heesen, V., Krause, M., Beck, R., et al. 2018, MNRAS, 476, 158 [CrossRef] [Google Scholar]
- Heiles, C. 1984, ApJS, 55, 585 [NASA ADS] [CrossRef] [Google Scholar]
- Irwin, J., Beck, R., Benjamin, R. A., et al. 2012, AJ, 144, 43 [Google Scholar]
- Irwin, J., Beck, R., Cook, T., et al. 2024, Galaxies, 12, 22 [NASA ADS] [CrossRef] [Google Scholar]
- Koo, B.-C., Heiles, C., & Reach, W. T. 1992, ApJ, 390, 108 [NASA ADS] [CrossRef] [Google Scholar]
- Krause, M., Irwin, J., Wiegert, T., et al. 2018, A&A, 611, A72 [NASA ADS] [CrossRef] [EDP Sciences] [Google Scholar]
- Levy, R. C., Bolatto, A. D., Sánchez, S. F., et al. 2019, ApJ, 882, 84 [NASA ADS] [CrossRef] [Google Scholar]
- Lu, L.-Y., Li, J.-T., Vargas, C. J., et al. 2023, MNRAS, 519, 6098 [NASA ADS] [CrossRef] [Google Scholar]
- Murphy, E. J., Helou, G., Kenney, J. D. P., et al. 2008, ApJ, 678, 828 [NASA ADS] [CrossRef] [Google Scholar]
- Nelder, J. A., & Mead, R. 1965, Comput. J., 7, 308 [Google Scholar]
- O’Brien, J. C., Freeman, K. C., & van der Kruit, P. C. 2010, A&A, 515, A62 [CrossRef] [EDP Sciences] [Google Scholar]
- Oosterloo, T., Fraternali, F., & Sancisi, R. 2007, AJ, 134, 1019 [Google Scholar]
- Press, W. H., Teukolsky, S. A., Vetterling, W. T., et al. 1992, Numerical Recipes in FORTRAN. The Art of Scientific Computing [Google Scholar]
- Rand, R. J., Kulkarni, S. R., & Hester, J. J. 1990, ApJ, 352, L1 [NASA ADS] [CrossRef] [Google Scholar]
- Stein, Y., Dettmar, R.-J., Irwin, J., et al. 2019a, A&A, 623, A33 [NASA ADS] [CrossRef] [EDP Sciences] [Google Scholar]
- Stein, Y., Dettmar, R.-J., Weżgowiec, M., et al. 2019b, A&A, 632, A13 [NASA ADS] [CrossRef] [EDP Sciences] [Google Scholar]
- Stein, Y., Dettmar, R.-J., Beck, R., et al. 2020, A&A, 639, A111 [NASA ADS] [CrossRef] [EDP Sciences] [Google Scholar]
- Tabatabaei, F. S., Beck, R., Krügel, E., et al. 2007, A&A, 475, 133 [CrossRef] [EDP Sciences] [Google Scholar]
- Vieu, T., Gabici, S., Tatischeff, V., et al. 2022, MNRAS, 512, 1275 [NASA ADS] [CrossRef] [Google Scholar]
- Vollmer, B., Soida, M., Beck, R., et al. 2013, A&A, 553, A116 [NASA ADS] [CrossRef] [EDP Sciences] [Google Scholar]
- Vollmer, B., Soida, M., Beck, R., et al. 2020, A&A, 633, A144 [NASA ADS] [CrossRef] [EDP Sciences] [Google Scholar]
- Vollmer, B., Soida, M., & Dallant, J. 2022, A&A, 667, A30 [NASA ADS] [CrossRef] [EDP Sciences] [Google Scholar]
- Vollmer, B., Freundlich, J., Gratier, P., et al. 2025, A&A, 693, A267 [NASA ADS] [CrossRef] [EDP Sciences] [Google Scholar]
- Wiegert, T., Irwin, J., Miskolczi, A., et al. 2015, AJ, 150, 81 [Google Scholar]
- Zurita, A., Rozas, M., & Beckman, J. E. 2000, A&A, 363, 9 [Google Scholar]
Appendix A: Observations
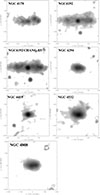 |
Fig. A.1. Nonthermal radio continuum emission distributions at 6 cm. The contours are (3, 5, 9, 17, 33, 65, 129, 257, 513, 1025)×ξ with ξ = (11, 19, 8, 11, 11, 12, 20) μJy/beam for NGC 4178, NGC 4192, NGC 4192CHANGES, NGC 4294, NGC 4419, NGC 4532, and NGC 4808, respectively. |
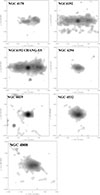 |
Fig. A.2. Nonthermal radio continuum emission distributions at 20 cm. The contours are (3, 5, 9, 17, 33, 65, 129, 257, 513, 1025)×ξ with ξ = (69, 109, 9, 100, 66, 127, 90) μJy/beam for NGC 4178, NGC 4192, NGC 4192CHANGES, NGC 4294, NGC 4419, NGC 4532, and NGC 4808, respectively. |
Appendix B: Deprojected star formation maps
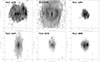 |
Fig. B.1. Deprojected distributions of the SFR surface density plotted with a square-root transmission function. The units are arbitrary. |
Appendix C: Radio continuum halo model
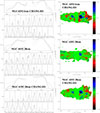 |
Fig. C.1. Radio continuum halo model of NGC 4192. Left column: profiles along the minor and major axes. Solid lines: observations, dashed lines: model including a a thin disk and a halo, dotted lines: model including only a thin disk. All distance are in arcseconds. Right column: maps of the model residuals in units of the rms. |
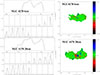 |
Fig. C.2. Radio continuum halo model of NGC 4178. Left column: profiles along the minor and major axes. Solid lines: observations, dashed lines: model including a a thin disk and a halo, dotted lines: model including only a thin disk. All distance are in arcseconds. Right column: maps of the model residuals in units of the rms. |
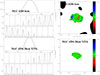 |
Fig. C.3. Radio continuum halo models of NGC 4294. Left column: profiles along the minor and major axes. Solid lines: observations, dashed lines: model including a a thin disk and a halo, dotted lines: model including only a thin disk. All distance are in arcseconds. Right column: maps of the model residuals in units of the rms. |
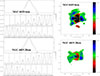 |
Fig. C.4. Radio continuum halo models of NGC 4419. Left column: profiles along the minor and major axes. Solid lines: observations, dashed lines: model including a a thin disk and a halo, dotted lines: model including only a thin disk. All distance are in arcseconds. Right column: maps of the model residuals in units of the rms. |
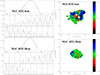 |
Fig. C.5. Radio continuum halo models of NGC 4532. Left column: profiles along the minor and major axes. Solid lines: observations, dashed lines: model including a a thin disk and a halo, dotted lines: model including only a thin disk. All distance are in arcseconds. Right column: maps of the model residuals in units of the rms. |
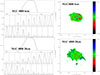 |
Fig. C.6. Radio continuum halo models of NGC 4808. Left column: profiles along the minor and major axes. Solid lines: observations, dashed lines: model including a a thin disk and a halo, dotted lines: model including only a thin disk. All distance are in arcseconds. Right column: maps of the model residuals in units of the rms. |
Appendix D: Radio halo scale heights
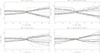 |
Fig. D.1. Radial profiles of the halo scale height of NGC 4192. All ten models. Lower four panels: best four models. Models with a low χ2 are red, those with a high χ2 are blue. |
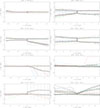 |
Fig. D.2. Radial profiles of the halo scale height of NGC 4178, NGC 4294, NGC 4419, and NGC 4532. All ten models. Models with a low χ2 are red, those with a high χ2 are blue. |
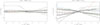 |
Fig. D.3. Radial profiles of the halo scale height of NGC 4808. All ten models. Models with a low χ2 are red, those with a high χ2 are blue. |
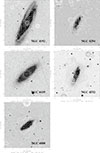 |
Fig. D.4. Total power emission distribution at 6 cm on DSS B band image together with the apparent B vectors (from Vollmer et al. 2013). Contour levels are ξ × ( − 3, 3, 5, 8, 12, 20, 30, 50, 80, 120, 200, 300), with ξ = 16 μJy for NGC 4192, ξ = 10 μJy for NGC 4294, ξ = 11 μJy for NGC 4419, ξ = 18 μJy for NGC 4532, and ξ = 14 μJy for NGC 4808. |
All Tables
All Figures
|
Fig. 1. Radio continuum halo model of NGC 4192. Upper panel: Profiles along the minor and major axes. The solid lines show observations, the dashed lines show the model including a a thin disk and a halo, and the dotted lines show the model with only a thin disk. All distance are in arcseconds. Lower left panel: Locations of the slices along the major and minor axis. Lower right panel: Maps of the model residuals in units of the rms. |
| In the text | |
|
Fig. 2. Radial profiles of the halo scale height of NGC 4192. Upper panel: All ten models. Lower panel: Four best models. The models with a low χ2 are plotted in red, and the models with a high χ2 are shown in blue. |
| In the text | |
|
Fig. 3. Radial profiles of the halo scale height of NGC 4178, NGC 4294, NGC 4419, and NGC 4532. We show the four best models. The models with a low χ2 are plotted in red, and the models with a high χ2 are shown in blue. |
| In the text | |
|
Fig. 4. Radial profiles of the halo scale height of NGC 4808. We show the four best models. The models with a low χ2 are plotted in red, and the models with a high χ2 are shown in blue. |
| In the text | |
|
Fig. 5. Halo scale heights as function of the radio diameter. The triangles show CHANG-ES galaxies at 6 cm, the pluses show CHANG-ES galaxies at 20 cm, the boxes show Virgo galaxies at 6 cm, and the asterisks show Virgo galaxies at 20 cm. |
| In the text | |
|
Fig. 6. CHANG-ES galaxies: Height ratio at 20 cm and 6 cm as a function of the spectral index between 20 cm and 6 cm. The triangles show SPINNAKER models of halos with advection. The diamond shows the SPINNAKER model of a halo that is dominated by synchrotron loss with diffusion. |
| In the text | |
|
Fig. 7. NGC 4192. We show th height ratio as a function of the spectral index between 20 cm and 6 cm. Panels (a,b) show the mean of all ten models, and panels (c,d) show the mean of the four best-fit models. |
| In the text | |
|
Fig. 8. NGC 4178. We show the height ratio as a function of the spectral index between 20 cm and 6 cm. Upper panel: Mean of all ten models. Lower panel: Mean of the four best-fit models. |
| In the text | |
|
Fig. 9. NGC 4294. We show the height ratio as a function of the spectral index between 20 cm and 6 cm. Upper panel: Mean of all ten models. Lower panel: Mean of the four best-fit models. |
| In the text | |
|
Fig. 10. NGC 4419. We show the height ratio as a function of the spectral index between 20 cm and 6 cm. Upper panel: Mean of all ten models. Lower panel: Mean of the four best-fit models. |
| In the text | |
|
Fig. 11. NGC 4532. We show the height ratio as a function of the spectral index between 20 cm and 6 cm. Upper panel: Mean of all ten models. Lower panel: Mean of the four best-fit models. |
| In the text | |
|
Fig. 12. NGC 4808. We show the height ratio as a function of the spectral index between 20 cm and 6 cm. Upper panel: Mean of all ten models. Lower panel: Mean of the four best-fit models. |
| In the text | |
|
Fig. 13. Quantities averaged over all four quadrants: Height ratio at 20 cm and 6 cm as a function of the spectral index between 20 cm and 6 cm. Upper panel: Based on all ten models. Lower panel: Based on the four best-fit models. |
| In the text | |
|
Fig. A.1. Nonthermal radio continuum emission distributions at 6 cm. The contours are (3, 5, 9, 17, 33, 65, 129, 257, 513, 1025)×ξ with ξ = (11, 19, 8, 11, 11, 12, 20) μJy/beam for NGC 4178, NGC 4192, NGC 4192CHANGES, NGC 4294, NGC 4419, NGC 4532, and NGC 4808, respectively. |
| In the text | |
|
Fig. A.2. Nonthermal radio continuum emission distributions at 20 cm. The contours are (3, 5, 9, 17, 33, 65, 129, 257, 513, 1025)×ξ with ξ = (69, 109, 9, 100, 66, 127, 90) μJy/beam for NGC 4178, NGC 4192, NGC 4192CHANGES, NGC 4294, NGC 4419, NGC 4532, and NGC 4808, respectively. |
| In the text | |
|
Fig. B.1. Deprojected distributions of the SFR surface density plotted with a square-root transmission function. The units are arbitrary. |
| In the text | |
|
Fig. C.1. Radio continuum halo model of NGC 4192. Left column: profiles along the minor and major axes. Solid lines: observations, dashed lines: model including a a thin disk and a halo, dotted lines: model including only a thin disk. All distance are in arcseconds. Right column: maps of the model residuals in units of the rms. |
| In the text | |
|
Fig. C.2. Radio continuum halo model of NGC 4178. Left column: profiles along the minor and major axes. Solid lines: observations, dashed lines: model including a a thin disk and a halo, dotted lines: model including only a thin disk. All distance are in arcseconds. Right column: maps of the model residuals in units of the rms. |
| In the text | |
|
Fig. C.3. Radio continuum halo models of NGC 4294. Left column: profiles along the minor and major axes. Solid lines: observations, dashed lines: model including a a thin disk and a halo, dotted lines: model including only a thin disk. All distance are in arcseconds. Right column: maps of the model residuals in units of the rms. |
| In the text | |
|
Fig. C.4. Radio continuum halo models of NGC 4419. Left column: profiles along the minor and major axes. Solid lines: observations, dashed lines: model including a a thin disk and a halo, dotted lines: model including only a thin disk. All distance are in arcseconds. Right column: maps of the model residuals in units of the rms. |
| In the text | |
|
Fig. C.5. Radio continuum halo models of NGC 4532. Left column: profiles along the minor and major axes. Solid lines: observations, dashed lines: model including a a thin disk and a halo, dotted lines: model including only a thin disk. All distance are in arcseconds. Right column: maps of the model residuals in units of the rms. |
| In the text | |
|
Fig. C.6. Radio continuum halo models of NGC 4808. Left column: profiles along the minor and major axes. Solid lines: observations, dashed lines: model including a a thin disk and a halo, dotted lines: model including only a thin disk. All distance are in arcseconds. Right column: maps of the model residuals in units of the rms. |
| In the text | |
|
Fig. D.1. Radial profiles of the halo scale height of NGC 4192. All ten models. Lower four panels: best four models. Models with a low χ2 are red, those with a high χ2 are blue. |
| In the text | |
|
Fig. D.2. Radial profiles of the halo scale height of NGC 4178, NGC 4294, NGC 4419, and NGC 4532. All ten models. Models with a low χ2 are red, those with a high χ2 are blue. |
| In the text | |
|
Fig. D.3. Radial profiles of the halo scale height of NGC 4808. All ten models. Models with a low χ2 are red, those with a high χ2 are blue. |
| In the text | |
|
Fig. D.4. Total power emission distribution at 6 cm on DSS B band image together with the apparent B vectors (from Vollmer et al. 2013). Contour levels are ξ × ( − 3, 3, 5, 8, 12, 20, 30, 50, 80, 120, 200, 300), with ξ = 16 μJy for NGC 4192, ξ = 10 μJy for NGC 4294, ξ = 11 μJy for NGC 4419, ξ = 18 μJy for NGC 4532, and ξ = 14 μJy for NGC 4808. |
| In the text | |
Current usage metrics show cumulative count of Article Views (full-text article views including HTML views, PDF and ePub downloads, according to the available data) and Abstracts Views on Vision4Press platform.
Data correspond to usage on the plateform after 2015. The current usage metrics is available 48-96 hours after online publication and is updated daily on week days.
Initial download of the metrics may take a while.