Fig. 1
Download original image
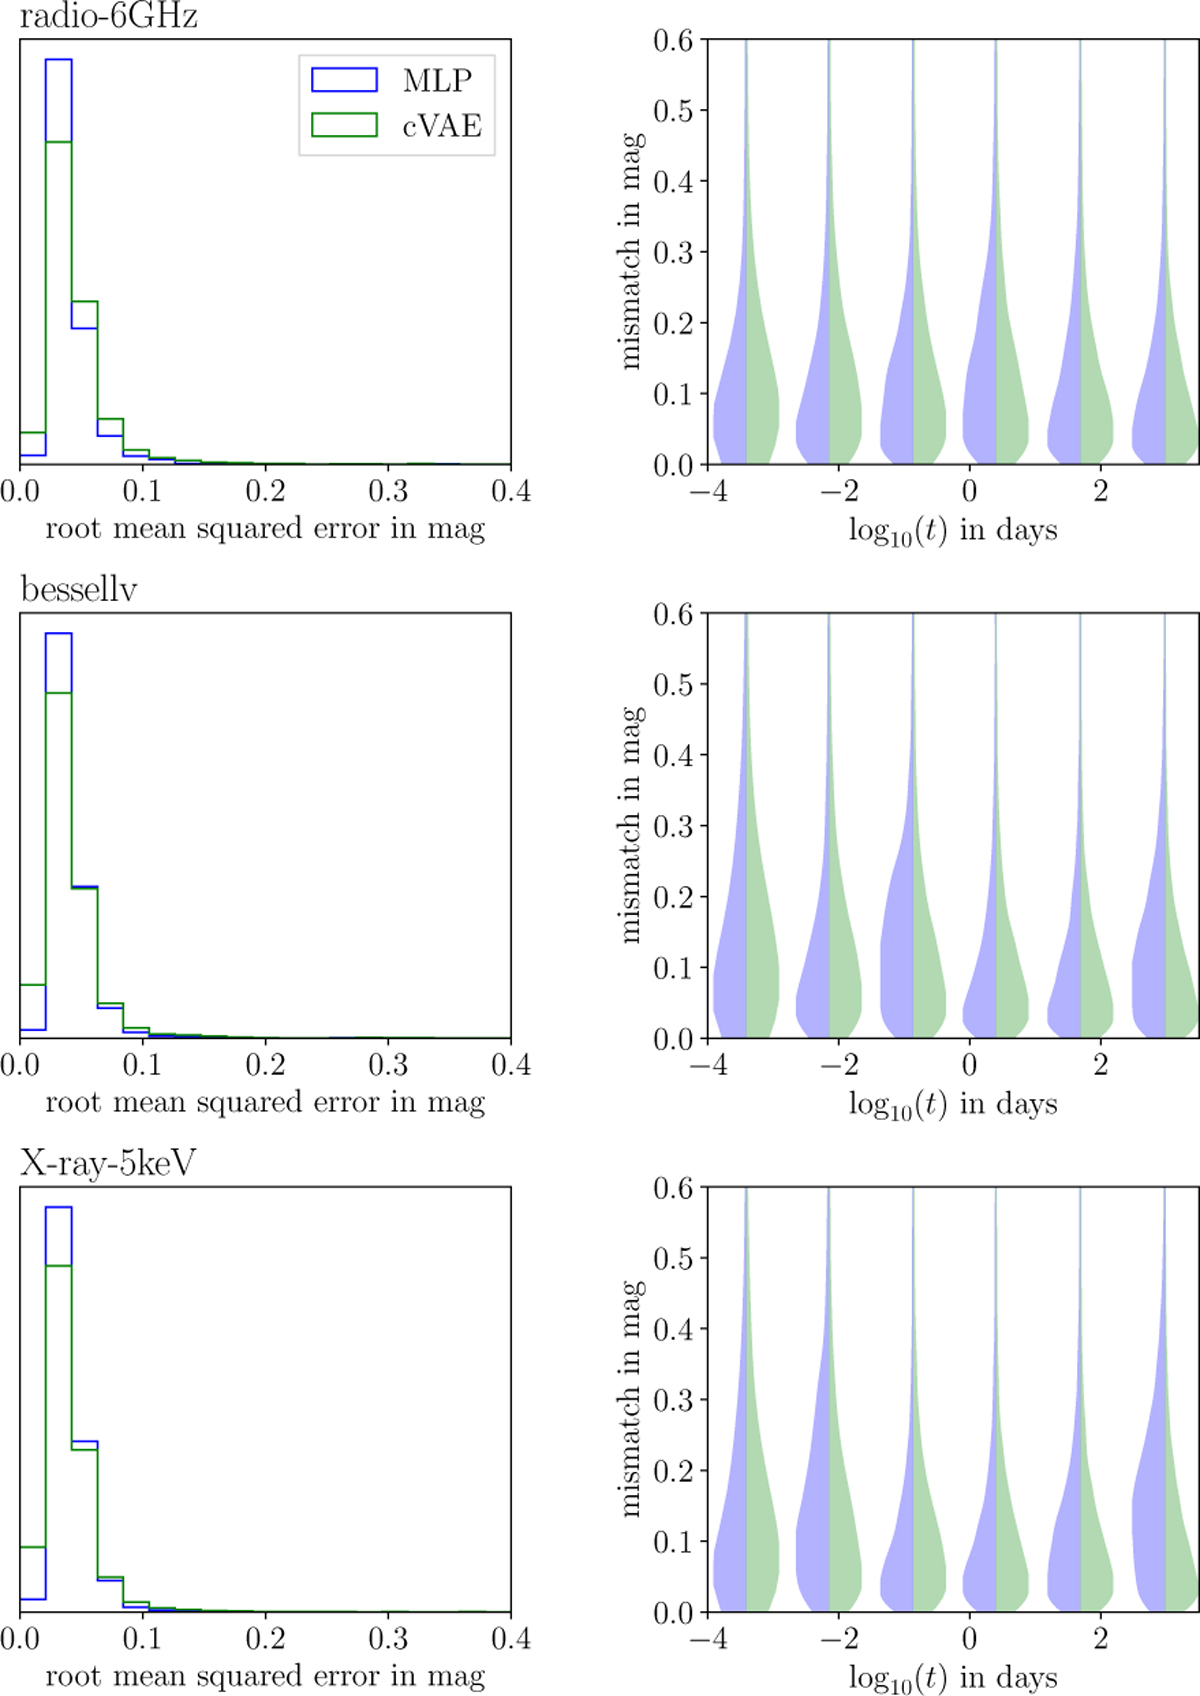
Benchmarks of the two surrogates for the AFTERGLOWPY Gaussian jet model. We show the error distributions of the surrogate predictions against a test data set of size ntest = 7500. The different rows show the error across different passbands. The left panels show the distribution of the mean squared error as defined in Eq. (9). The right panels show the mismatch distribution across the test data set as defined in Eq. (10). The figure compares two different surrogates: one using the MLP architecture (blue) and the other a cVAE (green).
Current usage metrics show cumulative count of Article Views (full-text article views including HTML views, PDF and ePub downloads, according to the available data) and Abstracts Views on Vision4Press platform.
Data correspond to usage on the plateform after 2015. The current usage metrics is available 48-96 hours after online publication and is updated daily on week days.
Initial download of the metrics may take a while.