Fig. 10
Download original image
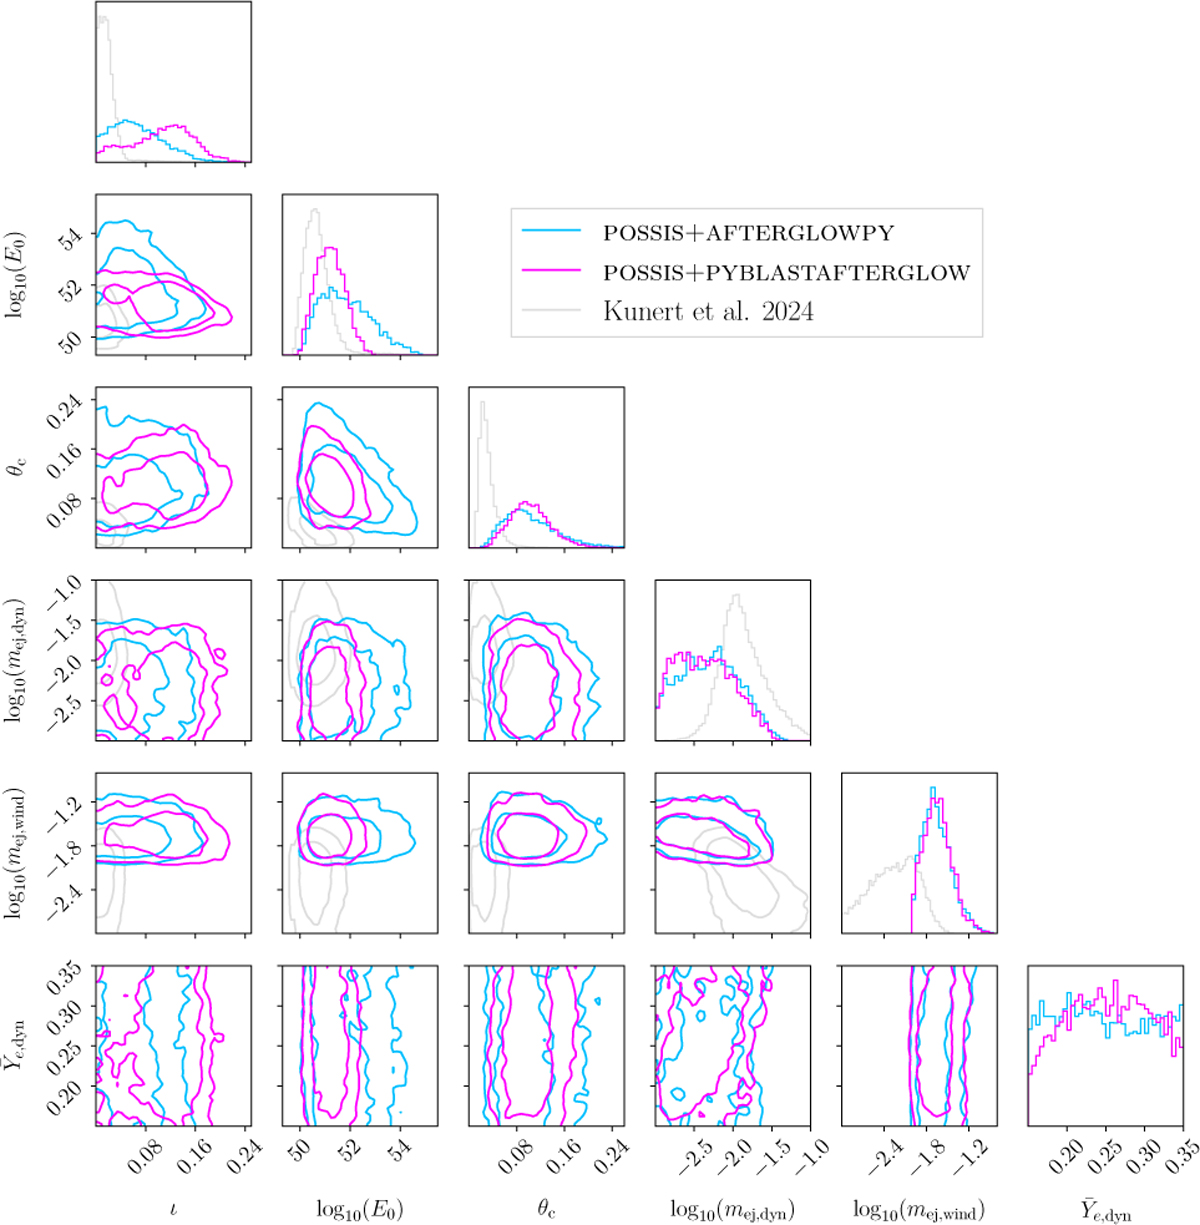
Posterior of the joint KN+GRB afterglow analyses of GRB211211A. Selected parameters are shown in the corner plot. The full corner plot can be accessed in our data repository. The lightblue contours indicate the posterior when the GRB afterglow part is fit with AFTERGLOWPY, magenta is the posterior from PYBLASTAFTERGLOW. Both inferences use the KN surrogate from POSSIS. The lightgrey contours show the analysis from Kunert et al. (2024) as a reference.
Current usage metrics show cumulative count of Article Views (full-text article views including HTML views, PDF and ePub downloads, according to the available data) and Abstracts Views on Vision4Press platform.
Data correspond to usage on the plateform after 2015. The current usage metrics is available 48-96 hours after online publication and is updated daily on week days.
Initial download of the metrics may take a while.