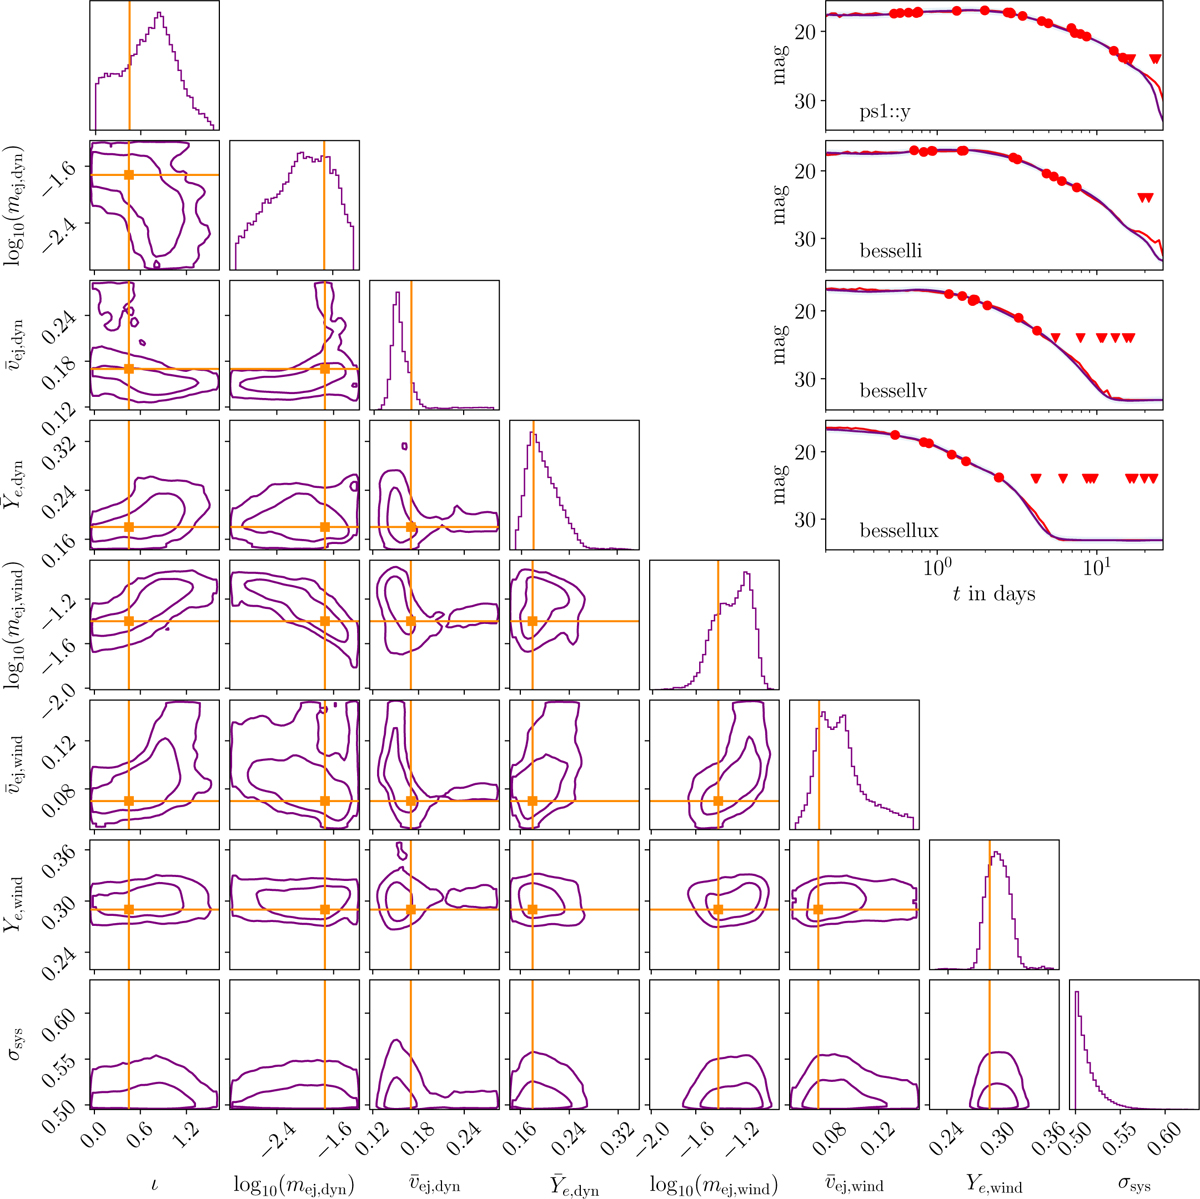
Fig. B.2
Download original image
Parameter recovery for an injected mock light curve from the Gaussian pyblastafterglow jet model. Figure layout as in Fig. 4. The injection is from the POSSIS directly, the recovery is with the fiesta surrogate and the flowMC sampler. The insets on the upper right side show the injection data with the best-fit light curve (purple) and the true POSSIS light curve (red). Triangles indicate upper mock detection limits at 24 mag placed to prevent the surrogate being used on parts of the light curve where the training data is subject to Monte Carlo noise.
Current usage metrics show cumulative count of Article Views (full-text article views including HTML views, PDF and ePub downloads, according to the available data) and Abstracts Views on Vision4Press platform.
Data correspond to usage on the plateform after 2015. The current usage metrics is available 48-96 hours after online publication and is updated daily on week days.
Initial download of the metrics may take a while.