Fig. 9
Download original image
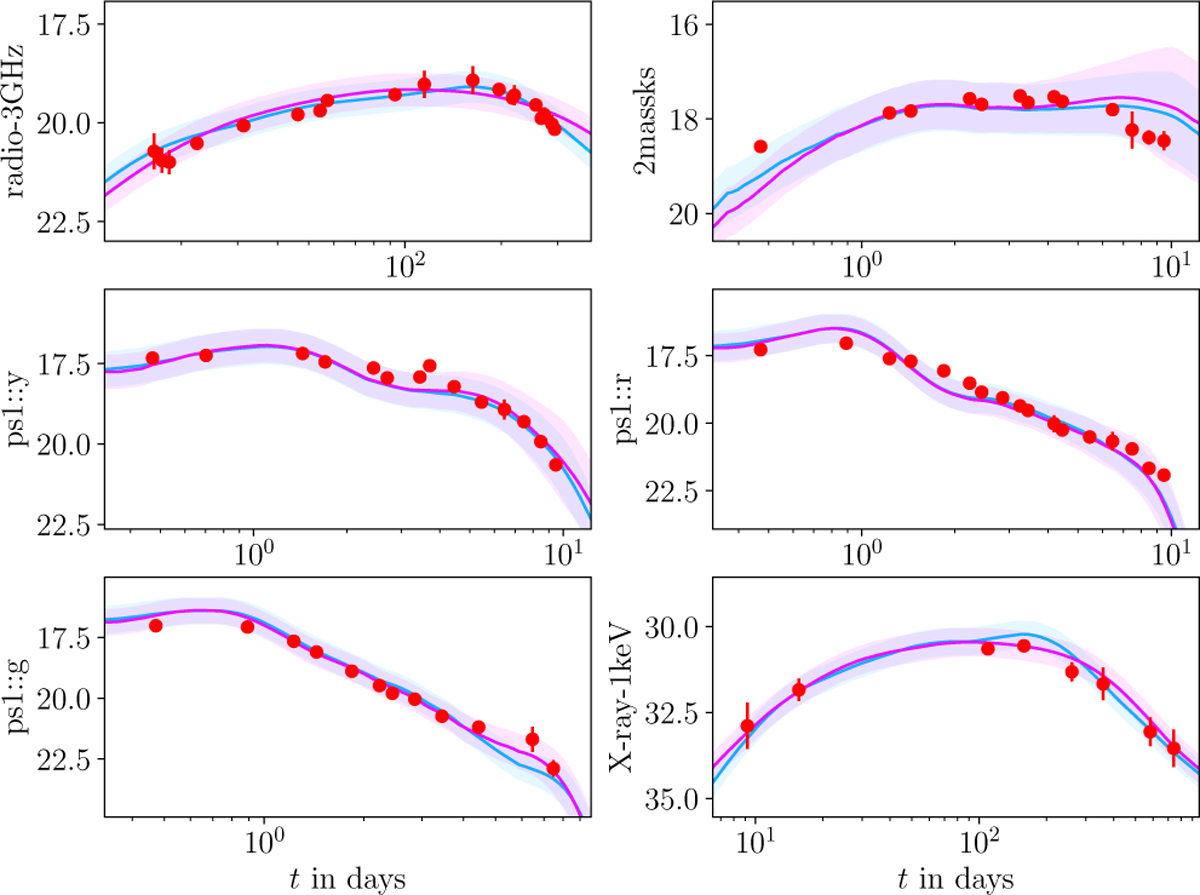
Best-fit light curves from the joint analyses of AT2017gfo/GRB170817A for selected photometric filters. The red data points show their 1σ error bars. The best-fit light curves from the analysis with AFTERGLOWPY (PYBLASTAFTERGLOW) are drawn as solid lines in light-blue (magenta). The colored bands indicate the 1σ systematic uncertainty as determined from the systematic nuisance parameters sampled for this light curve.
Current usage metrics show cumulative count of Article Views (full-text article views including HTML views, PDF and ePub downloads, according to the available data) and Abstracts Views on Vision4Press platform.
Data correspond to usage on the plateform after 2015. The current usage metrics is available 48-96 hours after online publication and is updated daily on week days.
Initial download of the metrics may take a while.