| Issue |
A&A
Volume 704, December 2025
|
|
|---|---|---|
| Article Number | L1 | |
| Number of page(s) | 5 | |
| Section | Letters to the Editor | |
| DOI | https://doi.org/10.1051/0004-6361/202557337 | |
| Published online | 02 December 2025 | |
Letter to the Editor
The interstellar flux gap: From dust to kilometer-scale objects
1
Department of Applied Mathematics and Aerospace Engineering, Universitat d’Alacant, 03690 Alacant, Spain
2
Department of Aerospace Science and Technology, Politecnico di Milano, Via La Masa 34, 20156 Milano, Italy
3
Department of Physics and Astronomy, Michigan State University, East Lansing, MI 48824, USA
⋆ Corresponding author: This email address is being protected from spambots. You need JavaScript enabled to view it.
Received:
20
September
2025
Accepted:
29
October
2025
Abstract
Context. Three kilometer-sized interstellar objects (ISOs) have been detected transiting the Solar System, and spacecraft have directly measured micrometer-scale interstellar dust (ISD). Yet no intermediate-size interstellar meteoroids have been identified in current meteor surveys.
Aims. We test whether a power-law flux extrapolation connecting spacecraft ISD and kilometer-scale ISOs is consistent with meteor surveys, and we quantify the expected interstellar impacting flux based on various observational reports.
Methods. We compiled differential fluxes and limits from spacecraft ISD, radar and optical meteor surveys, and theoretical estimates. We evaluated the power-law size–frequency fits, computed the 3I-like flux, and compared measured fluxes to predictions.
Results. The spacecraft-measured dust flux exceeds extrapolations constrained by meteor surveys and kilometer-scale ISOs by ∼2–7 orders of magnitude. An r−3.0 fit combining spacecraft ISD detections with kilometer-scale ISOs overpredicts the number of meteors with hyperbolic orbits, whereas slopes of r−2.7–r−2.3 (derived from radar and optical meteor upper limits, respectively) instead yield interplanetary-to-interstellar flux ratios of 103–106.
Conclusions. A simple power-law from ISD to ISOs is inconsistent with meteor survey constraints and yields unrealistic predictions for interstellar meteoroids. The data reveal a gap between submicron dust entrained in the Local Interstellar Cloud (LIC) and macroscopic bodies ejected from planetary systems. This gap may reflect distinct origins and destruction-transport processes rather than a continuous size-frequency distribution. This would imply either the dominance of a small-particle LIC component or the need to reassess spacecraft dust fluxes.
Key words: Earth / meteorites / meteors / meteoroids / minor planets / asteroids: general
© The Authors 2025
 Open Access article, published by EDP Sciences, under the terms of the Creative Commons Attribution License (https://creativecommons.org/licenses/by/4.0), which permits unrestricted use, distribution, and reproduction in any medium, provided the original work is properly cited.
This article is published in open access under the Subscribe to Open model. This email address is being protected from spambots. You need JavaScript enabled to view it. to support open access publication.
1. Introduction
There have been three detections of macroscopic kilometer-scale interstellar objects (ISOs) traversing the Solar System: 1I/‘Oumuamua Williams et al. 2017, 2I/Borisov Borisov et al. 2019, and 3I/ATLAS Denneau et al. 2025. There have also been in situ measurements of much smaller – approximately micron-scale – interstellar dust (ISD) particles by spacecraft. In particular, the Ulysses and Galileo spacecraft measurements have provided a calibration of the ISD flux Grun et al. 1993; Grün et al. 1997, 2000; Landgraf et al. 2000. Attempts have been made to fit a power-law extrapolation for the size frequency distribution of ISD to the meter scale in order to estimate upper limits of interstellar meteoroids Musci et al. 2012. It is natural to extend this size-frequency distribution to that of ISOs implied by 1I/‘Oumuamua into a single power-law spanning approximately ten orders of magnitude, for example as performed in Figure 19 of Jewitt & Seligman 2023.
Extrapolating this slope predicts the existence of numerous millimeter- to meter-scale interstellar impactors that should already have been detected by current meteor networks. However, the results from extant meteor surveys do not support this prediction. The Canadian Meteor Orbit Radar (CMOR) contains only five 3σ hyperbolic candidates among 11 million orbits Froncisz et al. 2020. The Global Meteor Network (GMN) contains no secure millimeter-sized interstellar meteoroids and sets an upper limit ratio of ∼10−6 relative to the number of interplanetary meteors Wiegert et al. 2025.
One of the most reputed and extensive fireball compilations – the European Fireball Network (EN) catalog Borovička et al. 2022 – reports 15 (∼2%) hyperbolic events at a minimum 1σ confidence level, though this includes two events at a 3σ confidence. Nevertheless, the authors do not consider the events truly interstellar. Meteor and fireball databases typically list a small number of formally hyperbolic events (1-12%), but they are attributed to measurement error rather than being of a true interstellar origin Hajdukova et al. 2020; Hajduková et al. 2024. In Table we show a compilation of interstellar candidate impactors and confirmed macroscopic interstellar visitors. As expected, orbital solutions for fireballs are more accurate than those for radar meteors, but their uncertainties remain well above the precision achieved for telescopic observations of kilometer-sized ISOs. Candidate meteoroids with hyperbolic orbits detected by radar are exclusively prograde (15°–67°), whereas the optical fireball candidates are retrograde, except for one case spanning 60°–170°. In contrast, the confirmed ISOs display no such preference: 1I/‘Oumuamua (122.7°; JPL-Horizons 2025a), 2I/Borisov (44.1°; JPL-Horizons 2025b), and 3I/ATLAS (175.1°; JPL-Horizons 2025c). They cover both prograde and retrograde regimes and are consistent with an isotropic distribution around 90°. However, radar favors lower-speed prograde orbits, while optical surveys favor luminous high-speed retrograde entries, so the inclination contrast may reflect detection bias and should not be overinterpreted.
A similar contrast is seen in eccentricity. The meteors cluster just above the parabolic limit (e ≤ 1.17), while the ISOs show far higher hyperbolic excess velocities and eccentricity values (e.g., e = 1.20 for 1I, e = 3.36 for 2I, e = 6.14 for 3I). Figure 1 shows eccentricity versus inclination for meteoroids with hyperbolic orbits and the three known ISOs.
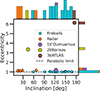 |
Fig. 1. Eccentricity versus inclination for hyperbolic fireballs reported in the EN catalog Borovička et al. 2022, hyperbolic meteor detections from CMOR radar surveys Froncisz et al. 2020, and the three known ISOs 1I/‘Oumuamua, 2I/Borisov, and 3I/ATLAS JPL-Horizons 2025a,b,c. Marginal histograms display the distribution of inclination (top) and eccentricity (right) for each dataset in logarithmic scale using colors consistent with the scatter plot. The dashed horizontal line marks e = 1. |
The perceived tension – namely, the absence of an observed intermediate-sized population – arises from a potentially invalid assumption that the spacecraft ISD sample and macroscopic ISOs belong to a single and uniform population. The spacecraft data consist of submicron grains entrained in the Local Interstellar Cloud (LIC) flow that are strongly coupled to interstellar and heliospheric magnetic fields. Their inferred flux depends strongly on selection and mass calibration. Alternative treatments shift the flux by factors on the order of two and contaminate the high-mass tail with interplanetary particles Baalmann et al. 2025. Moreover, no grains larger than ∼10 μm have been robustly detected in two decades. Destructive processes in the interstellar medium (ISM; sputtering, shattering) may truncate the ISD size distribution on timescales ≲0.6 Gyr Jones et al. 1994; Zhukovska et al. 2008; Bocchio et al. 2014; Zhukovska et al. 2016; Hu et al. 2019. This is significantly shorter than the ∼2.5 Gyr residence time Zhukovska et al. 2008, and therefore these processes may deplete large grains before arrival.
Combined with heliopause filtering, radiation-pressure cones, and solar cycle–driven Lorentz modulation, these destructive processes suggest a systematic underrepresentation of submicrometer to approximately millimeter ISD in spacecraft measurements. At the heliospheric boundary, nanometer to submicron grains are excluded by strong electromagnetic coupling. Aggregates in this region are more efficiently removed due to enhanced charging Sterken et al. 2012, 2019, 2022. Solar radiation pressure removes grains for which the ratio of radiation pressure to solar gravity exceeds unity. This creates paraboloid-shaped exclusion zones. At the same time, sub-0.4 μm particles are strongly deflected by Lorentz forces, which produce a 22-year modulation between focusing and defocusing phases Sterken et al. 2012, 2013. Both the ISM destruction and heliospheric modulation in concert reshape the incoming ISD population such that its size distribution at 1 AU may no longer reflect that of the LIC, with an expected flattening of the size-frequency distribution on smaller particles.
In contrast, ISOs are macroscopic planetesimals ejected from planetary systems that are effectively decoupled from magnetic forces and travel on gravitationally dominated hyperbolic trajectories. Their local number density and relative velocities and incoming directions should reflect stellar system dynamics Taylor & Seligman 2025; Seligman & Laughlin 2018; Moro-Martín & Norman 2022; Dorsey et al. 2025; Marčeta 2023; Marčeta & Seligman 2023; Hopkins et al. 2023, 2025, not the diffuse ISM. However, Forbes et al. 2025 have examined stellar stream–like modulations in ISO kinematics, but these are a second-order effect relative to dynamical heating.
2. Flux comparison
We assumed a radius range of 0.22–2.8 km Jewitt et al. 2025 and an asymptotic heliocentric speed of 58 km s−1 Seligman et al. 2025 for 3I/ATLAS, and we adopted a number density of 10−4 AU−3 for such objects Taylor & Seligman 2025. As a result, we obtained a flux of ∼1.7 ⋅ 10−33 m−2 s−1.
Different object fluxes are depicted in Figure 2 as a function of size. An immediate takeaway from the flux comparison presented in this figure is that a simple power-law extrapolation from spacecraft ISD to macroscopic ISOs does not hold. If the r−3.0 slope proposed by Jewitt & Seligman 2023 were valid across all scales, ∼0.1 mm interstellar impactors would be as common as our native interplanetary meteors Ceplecha 1988, which clearly does not occur.
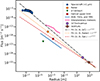 |
Fig. 2. Differential flux versus size based on Ulysses and Galileo spacecraft confident ISD detections Baalmann et al. 2025, hyperbolic meteor radar 3σ constraint in CMOR Froncisz et al. 2020, estimated > 100 μm objects impacting the Earth from α Centauri Gregg & Wiegert 2025, optical meteor upper limit in GMN Wiegert et al. 2025, estimated flux at Earth of objects from asymptotic giant branch (AGB) stars, young stellar objects (YSOs), and young main-sequence stars (YMSs; Murray et al. 2004), observed sporadic meteors on Earth with interplanetary orbits Ceplecha 1988, 1I/‘Oumuamua-like object flux Hajduková et al. 2019, and 3I/ATLAS-like object (this work). Linear fit fluxes are depicted for r−3.0 Jewitt & Seligman 2023, r−2.7 to match 1I and 3I with hyperbolic radar meteors, and r−2.3 to match 1I and 3I with upper limit hyperbolic optical meteors. |
As depicted in Figure 3, the power-law fit matching kilometer-scale visitors and constrained by hyperbolic radar measurements and kilometer-sized ISOs (r−2.7) indicates that the ISD flux detected by spacecraft (coming from the LIC) is on average two to four orders of magnitude greater than the extrapolated dust flux coming directly from other planetary systems. In contrast, relative to the fit constrained by the optical meteor upper limit and kilometer-sized ISOs r−2.3, the LIC flux would be approximately five to seven orders of magnitude smaller than the dust flux detected by spacecraft.
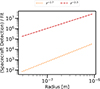 |
Fig. 3. Ratio of the measured differential flux of ISD detections by spacecraft to the corresponding derived power-law fit for interstellar impactors. Linear fit fluxes are depicted for r−2.7 to match 1I and 3I with hyperbolic radar meteors and for r−2.3 to match 1I and 3I with upper limit hyperbolic optical meteors (see Figure 2). |
Figure 4 shows a comparison of the power-law fit of r−3.0, as derived from dust detections of spacecraft and kilometer-scale ISO detections, would predict roughly one interstellar meteoroid per 10 to 103 interplanetary meteors – a ratio not supported by observations. Constraining the flux fit to the kilometer-sized ISOs with the radar-derived slope of r−2.7 or with the optical upper limit of r−2.3 instead predicts one interstellar meteoroid per 103 − 104 or 105 − 106 interplanetary meteors, respectively. The last values are more compatible with current meteor survey observations.
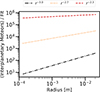 |
Fig. 4. Interplanetary-to-interstellar ratio of the measured differential flux of observed meteors on Earth to the corresponding derived power-law fit for interstellar impactors. The linear fit fluxes are depicted for r−3.0 Jewitt & Seligman 2023 to match 1I and 3I with ISD detections by spacecraft, r−2.7 to match 1I and 3I with hyperbolic radar meteors, and r−2.3 to match 1I and 3I with upper limit hyperbolic optical meteors (see Figure 2). |
This comparison assumes a single reservoir for the kilometer-scale ISO. The cometary activity of 2I/Borisov and 3I/ATLAS, contrasted with the lack of detected volatiles in 1I/‘Oumuamua, suggests that both cometary and asteroidal components likely contribute, with potentially different fluxes. This distinction will be better constrained as ISO statistics improve. It may also prove worthwhile to compare these fluxes with those implied by exocomet size-frequency distribution estimates for β Pictoris Lecavelier des Etangs et al. 2022 and RZ Psc Gibson et al. 2025.
Plotting spacecraft and kilometer-sized fluxes together produces an apparent alignment on a log–log diagram r−3.0. However, this may be coincidental given the large uncertainties and different physical origins and thus produce unrealistic predictions of interstellar meteoroids. The flux of submicron ISD detected by spacecraft from the LIC exceeds the expected flux of similarly-sized grains ejected from exoplanetary systems by several orders of magnitude. This implies that (i) there is a dominant local interstellar component of only small particles or (ii) the spacecraft measurements need to be reassessed, especially since the Ulysses and Galileo grain size distribution appears inconsistent with that inferred from interstellar extinction (Draine 2009).
3. Conclusion
In this paper, we have estimated the flux of ISOs implied by the detections of macroscopic ISOs and compared it with the fluxes derived from meteor surveys and spacecraft ISD measurements. The analyses presented here reveal a gap in our understanding of the incoming interstellar population. This could be best interpreted as a consequence of mixing distinct source populations, destruction processes, and transport regimes rather than as evidence for a single, continuous size-frequency distribution. Future progress requires (i) large-area dust instruments with precise trajectory reconstruction to discriminate interstellar from interplanetary grains and (ii) meteor surveys with improved velocity accuracy, achieved through global coverage by higher temporal resolution instruments with long focal length optics, such as the Canadian Automated Meteor Observatory (CAMO; Weryk et al. 2013), to validate or reject hyperbolic events.
Acknowledgments
EP-A acknowledges support from the LUMIO project funded by the Agenzia Spaziale Italiana (2024-6-HH.0). DZS is supported by an NSF Astronomy and Astrophysics Postdoctoral Fellowship under award AST-2303553. This research award is partially funded by a generous gift of Charles Simonyi to the NSF Division of Astronomical Sciences. The award is made in recognition of significant contributions to Rubin Observatory’s Legacy Survey of Space and Time.
References
- Baalmann, L. R., Janisch, T., Hunziker, S., et al. 2025, A&A, 698, A138 [NASA ADS] [CrossRef] [EDP Sciences] [Google Scholar]
- Bocchio, M., Jones, A. P., & Slavin, J. D. 2014, A&A, 570, A32 [NASA ADS] [CrossRef] [EDP Sciences] [Google Scholar]
- Borisov, G., Durig, D. T., Sato, H., et al. 2019, Cent. Bur. Electron. Telegrams, 4666, 1 [Google Scholar]
- Borovička, J., Spurný, P., & Shrbený, L. 2022, A&A, 667, A158 [NASA ADS] [CrossRef] [EDP Sciences] [Google Scholar]
- Ceplecha, Z. 1988, Bull. Astron. Inst. Czechoslovakia, 39, 221 [NASA ADS] [Google Scholar]
- Denneau, L., Siverd, R., Tonry, J., et al. 2025, MPEC [Google Scholar]
- Dorsey, R. C., Hopkins, M. J., Bannister, M. T., et al. 2025, Planet. Sci. J., 6, 214 [Google Scholar]
- Draine, B. T. 2009, Space Sci. Rev., 143, 333 [Google Scholar]
- Forbes, J. C., Bannister, M. T., Lintott, C., et al. 2025, ApJ, 988, 121 [Google Scholar]
- Froncisz, M., Brown, P., & Weryk, R. J. 2020, Planet. Space Sci., 190, 104980 [Google Scholar]
- Gibson, A., MacGregor, M. A., Howard, W. S., et al. 2025, ApJ, 993, L29 [Google Scholar]
- Gregg, C. R., & Wiegert, P. A. 2025, Planet. Sci. J., 6, 56 [Google Scholar]
- Grun, E., Zook, H. A., Baguhl, M., et al. 1993, Nature, 362, 428 [Google Scholar]
- Grün, E., Staubach, P., Baguhl, M., et al. 1997, Icarus, 129, 270 [Google Scholar]
- Grün, E., Landgraf, M., Horányi, M., et al. 2000, J. Geophys. Res., 105, 10403 [Google Scholar]
- Hajduková, M., Sterken, V., & Wiegert, P. 2019, Meteoroids: Sources of Meteors on Earth and Beyond (Cambridge University Press), 235 [Google Scholar]
- Hajdukova, M., Sterken, V., Wiegert, P., & Kornoš, L. 2020, Planet. Space Sci., 192, 105060 [NASA ADS] [CrossRef] [Google Scholar]
- Hajduková, M., Stober, G., Barghini, D., et al. 2024, A&A, 691, A8 [NASA ADS] [CrossRef] [EDP Sciences] [Google Scholar]
- Hopkins, M. J., Lintott, C., Bannister, M. T., Mackereth, J. T., & Forbes, J. C. 2023, AJ, 166, 241 [Google Scholar]
- Hopkins, M. J., Bannister, M. T., & Lintott, C. 2025, AJ, 169, 78 [Google Scholar]
- Hu, C.-Y., Zhukovska, S., Somerville, R. S., & Naab, T. 2019, MNRAS, 487, 3252 [NASA ADS] [CrossRef] [Google Scholar]
- Jewitt, D., & Seligman, D. Z. 2023, ARA&A, 61, 197 [NASA ADS] [CrossRef] [Google Scholar]
- Jewitt, D., Hui, M.-T., Mutchler, M., Kim, Y., & Agarwal, J. 2025, ApJ, 990, L2 [Google Scholar]
- Jones, A. P., Tielens, A. G. G. M., Hollenbach, D. J., & McKee, C. F. 1994, ApJ, 433, 797 [NASA ADS] [CrossRef] [Google Scholar]
- JPL-Horizons 2025a, 1I/‘Oumuamua orbit parameters, https://ssd.jpl.nasa.gov/tools/sbdb_lookup.html#/?sstr=2017%20U1, Accessed: 4th August 2025 [Google Scholar]
- JPL-Horizons 2025b, 1I/‘Oumuamua orbit parameters, https://ssd.jpl.nasa.gov/tools/sbdb_lookup.html#/?sstr=C%2F2019%20Q4, Accessed: 4th August 2025 [Google Scholar]
- JPL-Horizons 2025c, 3I/ATLAS orbit parameters, https://ssd.jpl.nasa.gov/tools/sbdb_lookup.html#/?des=2025%20N1, Accessed: 4th August 2025 [Google Scholar]
- Landgraf, M., Baggaley, W. J., Grün, E., Krüger, H., & Linkert, G. 2000, J. Geophys. Res., 105, 10343 [NASA ADS] [CrossRef] [Google Scholar]
- Lecavelier des Etangs, A., Cros, L., Hébrard, G., et al. 2022, Sci. Rep., 12, 5855 [NASA ADS] [CrossRef] [Google Scholar]
- Marčeta, D. 2023, Astron. Comput., 42, 100690 [Google Scholar]
- Marčeta, D., & Seligman, D. Z. 2023, Planet. Sci. J., 4, 230 [CrossRef] [Google Scholar]
- Moro-Martín, A., & Norman, C. 2022, ApJ, 924, 96 [Google Scholar]
- Murray, N., Weingartner, J. C., & Capobianco, C. 2004, ApJ, 600, 804 [NASA ADS] [CrossRef] [Google Scholar]
- Musci, R., Weryk, R. J., Brown, P., Campbell-Brown, M. D., & Wiegert, P. A. 2012, ApJ, 745, 161 [NASA ADS] [CrossRef] [Google Scholar]
- Seligman, D., & Laughlin, G. 2018, AJ, 155, 217 [Google Scholar]
- Seligman, D. Z., Micheli, M., Farnocchia, D., et al. 2025, ApJ, 989, L36 [Google Scholar]
- Sterken, V. J., Altobelli, N., Kempf, S., et al. 2012, A&A, 538, A102 [NASA ADS] [CrossRef] [EDP Sciences] [Google Scholar]
- Sterken, V. J., Altobelli, N., Kempf, S., et al. 2013, A&A, 552, A130 [NASA ADS] [CrossRef] [EDP Sciences] [Google Scholar]
- Sterken, V. J., Westphal, A. J., Altobelli, N., Malaspina, D., & Postberg, F. 2019, Space Sci. Rev., 215, 43 [NASA ADS] [CrossRef] [Google Scholar]
- Sterken, V. J., Baalmann, L. R., Draine, B. T., et al. 2022, Space Sci. Rev., 218, 71 [CrossRef] [Google Scholar]
- Taylor, A. G., & Seligman, D. Z. 2025, ApJ, 990, L14 [Google Scholar]
- Weryk, R. J., Campbell-Brown, M. D., Wiegert, P. A., et al. 2013, Icarus, 225, 614 [Google Scholar]
- Wiegert, P., Tran, V., Gregg, C., Vida, D., & Brown, P. 2025, ApJ, 984, 151 [Google Scholar]
- Williams, G. V., Sato, H., Sarneczky, K., et al. 2017, Cent. Bur. Electron. Telegrams, 4450, 1 [Google Scholar]
- Zhukovska, S., Gail, H. P., & Trieloff, M. 2008, A&A, 479, 453 [NASA ADS] [CrossRef] [EDP Sciences] [Google Scholar]
- Zhukovska, S., Dobbs, C., Jenkins, E. B., & Klessen, R. S. 2016, ApJ, 831, 147 [NASA ADS] [CrossRef] [Google Scholar]
Appendix A: Additional material
Supplementary data that complement the discussion in the main text are presented in this section: Table summarizes the properties of the candidate interstellar meteoroids and the confirmed ISOs considered in this study.
Properties of candidate interstellar meteoroids and confirmed ISOs.
All Tables
All Figures
|
Fig. 1. Eccentricity versus inclination for hyperbolic fireballs reported in the EN catalog Borovička et al. 2022, hyperbolic meteor detections from CMOR radar surveys Froncisz et al. 2020, and the three known ISOs 1I/‘Oumuamua, 2I/Borisov, and 3I/ATLAS JPL-Horizons 2025a,b,c. Marginal histograms display the distribution of inclination (top) and eccentricity (right) for each dataset in logarithmic scale using colors consistent with the scatter plot. The dashed horizontal line marks e = 1. |
| In the text | |
|
Fig. 2. Differential flux versus size based on Ulysses and Galileo spacecraft confident ISD detections Baalmann et al. 2025, hyperbolic meteor radar 3σ constraint in CMOR Froncisz et al. 2020, estimated > 100 μm objects impacting the Earth from α Centauri Gregg & Wiegert 2025, optical meteor upper limit in GMN Wiegert et al. 2025, estimated flux at Earth of objects from asymptotic giant branch (AGB) stars, young stellar objects (YSOs), and young main-sequence stars (YMSs; Murray et al. 2004), observed sporadic meteors on Earth with interplanetary orbits Ceplecha 1988, 1I/‘Oumuamua-like object flux Hajduková et al. 2019, and 3I/ATLAS-like object (this work). Linear fit fluxes are depicted for r−3.0 Jewitt & Seligman 2023, r−2.7 to match 1I and 3I with hyperbolic radar meteors, and r−2.3 to match 1I and 3I with upper limit hyperbolic optical meteors. |
| In the text | |
|
Fig. 3. Ratio of the measured differential flux of ISD detections by spacecraft to the corresponding derived power-law fit for interstellar impactors. Linear fit fluxes are depicted for r−2.7 to match 1I and 3I with hyperbolic radar meteors and for r−2.3 to match 1I and 3I with upper limit hyperbolic optical meteors (see Figure 2). |
| In the text | |
|
Fig. 4. Interplanetary-to-interstellar ratio of the measured differential flux of observed meteors on Earth to the corresponding derived power-law fit for interstellar impactors. The linear fit fluxes are depicted for r−3.0 Jewitt & Seligman 2023 to match 1I and 3I with ISD detections by spacecraft, r−2.7 to match 1I and 3I with hyperbolic radar meteors, and r−2.3 to match 1I and 3I with upper limit hyperbolic optical meteors (see Figure 2). |
| In the text | |
Current usage metrics show cumulative count of Article Views (full-text article views including HTML views, PDF and ePub downloads, according to the available data) and Abstracts Views on Vision4Press platform.
Data correspond to usage on the plateform after 2015. The current usage metrics is available 48-96 hours after online publication and is updated daily on week days.
Initial download of the metrics may take a while.