Fig. C.6.
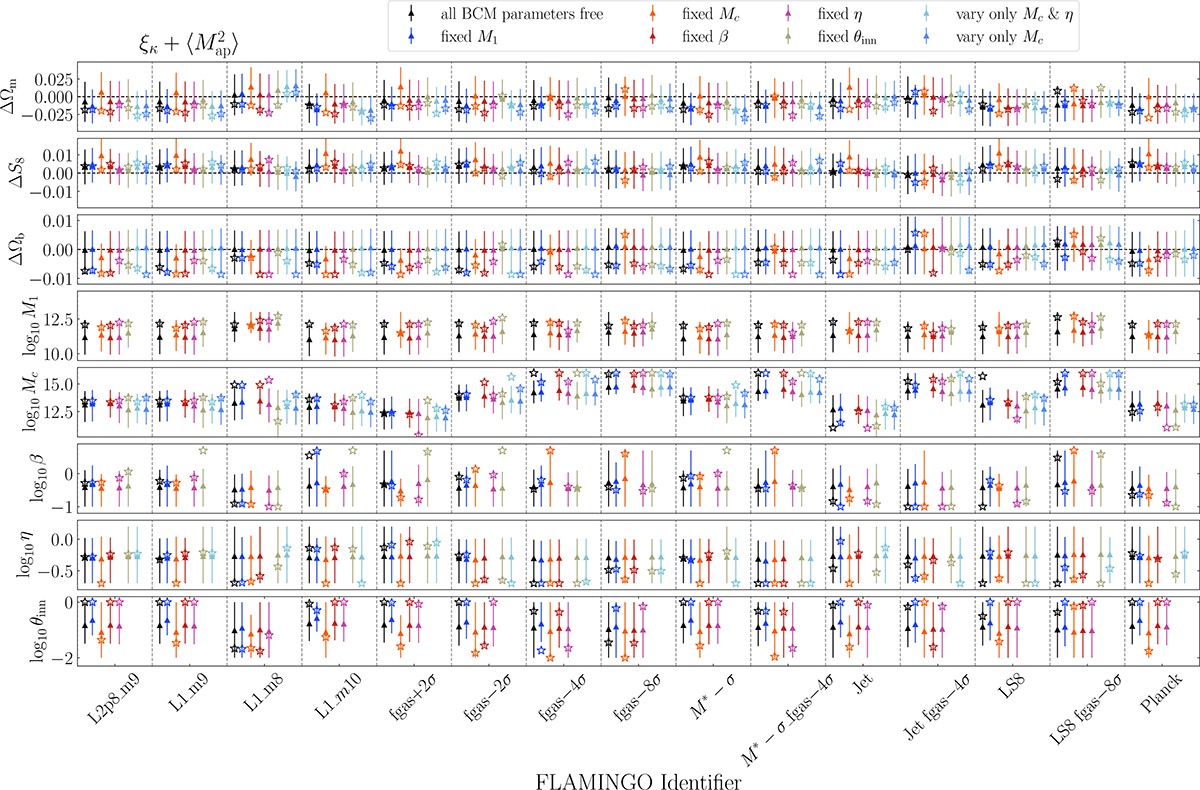
Download original image
Same as Fig. 8 but second-order statistics alone. The triangles with error bars are estimated from the MCMC chains for all FLAMINGO models described in Sect. 2.2. Since the LS8 and Planck cosmology is different we plot ΔΩm = Ωmbest − Ωmtrue and in analogy ΔS8 and and ΔΩb. The different colours show cases where parameters are fixed. The stars indicate the best-fitting parameters resulting from a minimisation process that returns the lowest χ2. The corresponding figure for ξκ + ⟨ℳap2⟩+⟨ℳap3⟩ is shown in Fig. 8.
Current usage metrics show cumulative count of Article Views (full-text article views including HTML views, PDF and ePub downloads, according to the available data) and Abstracts Views on Vision4Press platform.
Data correspond to usage on the plateform after 2015. The current usage metrics is available 48-96 hours after online publication and is updated daily on week days.
Initial download of the metrics may take a while.