Fig. 2.
Download original image
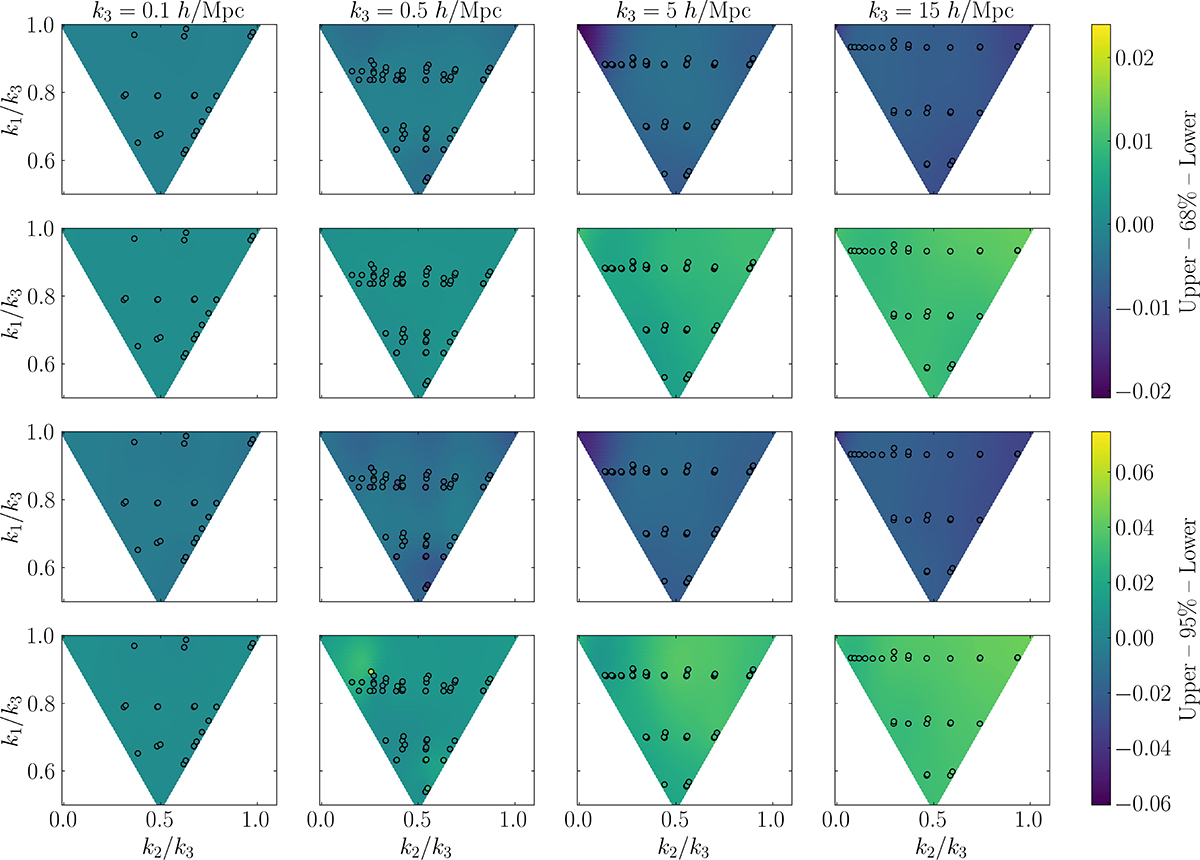
Accuracy of the emulator for baryonic effects on the matter bispectrum R(k). The upper two rows show the lower and upper 68% percentiles of ΔR(k), and the two lower rows show the lower and upper 95% percentiles of ΔR(k). Each column is for a different k3 value, which is by construction larger than k2 and k1 but smaller than k1 + k2. The black circles show the actual location where we have measured B(k1, k2, k3). The background is coloured using a linear interpolation/extrapolation of the percentiles between the measured k-values.
Current usage metrics show cumulative count of Article Views (full-text article views including HTML views, PDF and ePub downloads, according to the available data) and Abstracts Views on Vision4Press platform.
Data correspond to usage on the plateform after 2015. The current usage metrics is available 48-96 hours after online publication and is updated daily on week days.
Initial download of the metrics may take a while.