| Issue |
A&A
Volume 705, January 2026
|
|
|---|---|---|
| Article Number | L1 | |
| Number of page(s) | 8 | |
| Section | Letters to the Editor | |
| DOI | https://doi.org/10.1051/0004-6361/202558000 | |
| Published online | 19 December 2025 | |
Letter to the Editor
Evading the dust fragmentation barrier with the streaming instability in protoplanetary disks
1
Université Paris-Saclay, Université Paris Cité, CEA, CNRS, AIM, 91191 Gif-sur-Yvette, France
2
Department of Astrophysics, American Museum of Natural History, New York, NY 10024, USA
★ Corresponding author.
Received:
6
November
2025
Accepted:
26
November
2025
Abstract
Context. The streaming instability (SI) is a leading candidate for reaching solid densities sufficient to trigger the gravitational collapse needed for the formation of planetesimals. However, dust growth barriers appear to impede the ability to assemble sufficiently large dust particles to trigger strong clumping, providing a serious impediment to planetesimal formation.
Aims. We aim to address the possibility of enhancing dust clumping with dust growth in SI-produced structures, and to estimate the impact of the shift of the dust fragmentation threshold in regions where the SI has enhanced the dust density.
Methods. We performed two-dimensional numerical simulations of the SI with a monodisperse description of dust growth, accounting for the impact of mass loading of the dust on the sound speed of the gas and dust mixture when computing dust collisional velocities.
Results. Dust mass loading reduces collision velocities in high-density regions, allowing dust particles to survive to larger sizes before shattering. In turn, dust clumping is boosted as particles grow in size, as long as they remain sufficiently coupled to the gas.
Conclusions. This two-way synergy between dust growth and clumping, which depends on the initial dust-to-gas ratio and dust elastic properties, allows denser dust clumps to form, and thus facilitates the onset of planetesimal formation.
Key words: interplanetary medium / protoplanetary disks / dust / extinction / hydrodynamics / planets and satellites formation
© The Authors 2025
 Open Access article, published by EDP Sciences, under the terms of the Creative Commons Attribution License (https://creativecommons.org/licenses/by/4.0), which permits unrestricted use, distribution, and reproduction in any medium, provided the original work is properly cited.
This article is published in open access under the Subscribe to Open model. This email address is being protected from spambots. You need JavaScript enabled to view it. to support open access publication.
1. Introduction
In protoplanetary disks, the pathway to planetesimals remains unclear. One candidate to produce dust density fluctuations strong enough for the onset of a local gravitational instability (GI; Goldreich & Ward 1973) is the streaming instability (SI) (Youdin & Goodman 2005; Johansen & Youdin 2007) that produces filaments of high dust density form in a background of quasi-incompressible gas. However, the growth of pebbles to high enough Stokes numbers, St = tsΩ, is hindered by the so-called bouncing, fragmentation, and radial drift barriers (Birnstiel 2024).
Arguments have been made that the snow line is a privileged place for planetesimal formation (Schoonenberg & Ormel 2017; Drazkowska 2017). The role of external turbulence was studied in Umurhan et al. (2020) and Lim et al. (2024). Carrera et al. (2025a), Hühn et al. (2025) investigate how planetesimal formation responds to turbulence driven by accretion in young disks. Dust self-gravity was included in Johansen et al. (2015), Simon et al. (2016), Schäfer et al. (2017), Li et al. (2019) along with vertical stratification to self-consistently follow and describe the initial planetesimal mass function.
A broad parameter space of initial values of St and the surface dust-to-gas ratio, Zcrit, was studied in the literature (Carrera et al. 2015; Yang et al. 2017; Li & Youdin 2021; Carrera & Simon 2022) in order to define the conditions needed for strong clumping, i.e., to exceed the Roche density, ρR, and trigger the GI locally. Taking into account a full size distribution of dust particles, it was shown that growth rates of the instability tend to be reduced compared to the single species case (Paardekooper et al. 2020, 2021). However, this question is still under debate, with no apparent convergence of the dust dynamics and SI behavior with the number of bins considered in the dust size distribution model (Schaffer et al. 2021; Zhu & Yang 2021; Yang & Zhu 2021; Rucska & Wadsley 2023). Thus, planetesimal formation seems more challenging than was previously believed.
Recently, velocity dispersions of solid particles were measured in simulations (Schreiber & Klahr 2018) to estimate collisional velocities and dust coagulation rates (Tominaga & Tanaka 2023, 2025), with the conclusion being reached that collisional velocities driven by the coupling to turbulent vortices in the gas should be lower than those predicted by the widely used analytical sub-grid model of Ormel & Cuzzi (2007). Through analytical arguments, the work of Carrera et al. (2025b) suggests a positive synergy between dust coagulation and clumping by the SI, accounting for the back reaction produced by the mass loading of dust particles and the resulting attenuation of turbulence. This allows for the relaxation of the conditions for strong clumping.
Dust growth was included in simulations of SI for the first time, along with vertical stratification, by Ho et al. (2024). They show that dust clumping due to SI boosts dust growth, which in turn leads to SI modes associated with stronger density enhancements that exceed the Roche density more easily.
In this work, we perform high-resolution 2D simulations of the SI within a shearing box including monodisperse dust growth, with sticking and fragmentation. We use the turbulent collisional velocities damped by dust mass loading to model dust coagulation, and thus to investigate the possibility of a fragmentation barrier occurring at a larger size than was predicted by Ormel & Cuzzi (2007), in turn producing stronger dust clumping.
2. Methods
We used the grid-based SHARK code (Lebreuilly et al. 2023) to perform 2D simulations of a mixture of unmagnetized isothermal gas and a single dust species treated as a fluid, without vertical stratification. We modeled a local patch of the protoplanetary disk centered on the midplane within the shearing box framework (Goldreich & Tremaine 1978). The momentum equations for the gas and dust mixture are given in Appendix A. They include the hydrodynamic drag force between dust and gas, Fdrag = (ρd/ts)(vd − v), where ρd and vd are the dust density and velocity, and v is the gas velocity. The aspect ratio of the disk, (H/r) = 0.1, was taken to be constant with the radius. We worked in code units and set Ω = r = ρg, 0 = 1, where ρg, 0 is the initial gas density. This gave us a locally isothermal sound speed, cs = (H/r)vk = HΩ = 0.1, where vk is the Keplerian velocity. The stopping time was taken in the Epstein (1924) regime in which ts = (8/π)1/2(ρgrsd)/(ρgcs), where we took ρgr/ρg = 1011 to define the grain intrinsic density, ρgr, kept constant throughout the simulation (see Appendix B), so the Stokes number, St ∝sd, is a direct measure of the dust size.
2.1. Dust growth
We used a monodisperse approach to follow at low cost the evolution of a single dust species that follows the maximum of the dust size distribution. Assuming that the bulk of the mass is carried by the largest grain of the dust distribution, its evolution is given by Stepinski & Valageas (1996), Ormel & Spaans (2008), Estrada & Cuzzi (2008), Sato et al. (2016), Tsukamoto et al. (2017)
 (1)
(1)
where coagulation is driven by collisions of equal-size particles. The corresponding timescale is
 (2)
(2)
where K is the collision kernel, nd is the dust number density, mgr ≡ (4/3)πsd3ρgr is the mass of the dust grain, Δvturb is the turbulent induced velocity, and ϵ = ρd/ρg is the dust-to-gas mass ratio.
When fragmentation is included, complete shattering of the dust grains occurs whenever the collision velocity is
 (3)
(3)
where the fragmentation threshold velocity is vfrag.
2.2. Collision velocity
We considered turbulence to be the source of grain collisions. Following Carrera et al. (2025b), we used a modified sound speed,  , reduced by the mass loading of the gas by the dust particles. Assuming that turbulence is generated by a finite energy source that is partitioned between the gas and the dust,
![Mathematical equation: $$ \begin{aligned} \tilde{c}_\mathrm{s} = \frac{c_\mathrm{s} }{(1 + \epsilon /[1 + \mathrm{St} ])^{1/2}}\cdot \end{aligned} $$](/articles/aa/full_html/2026/01/aa58000-25/aa58000-25-eq5.gif) (4)
(4)
This mechanism is enhanced in regions of high dust concentration but saturates as St increases. The resulting relative velocity of each pair of grains in the intermediate regime is
 (5)
(5)
where  is the modified average gas velocity for a Shakura & Sunyaev (1976) turbulent viscosity parameter of α that we take in our models as 10−4, consistent with observations from ALMA (Villenave et al. 2022) and values measured in SI simulations in Bai & Stone (2010) and Schreiber & Klahr (2018). We note that this environment-dependent parameter is important, as a value of 10−3 (more intense turbulence) would lead to collision velocities about three times larger.
Using the fragmentation condition (Eqs. (3) and (5)), we see that mass loading allows the fragmentation barrier, Stfrag = vfrag2/1.97Vg2, to be pushed to higher values,  :
:
 (6)
(6)
This is a second-order polynomial that yields a single physically relevant root given in Carrera et al. (2025b).
2.3. Parameters
We explored three different values of the initial dust-to-gas ratio, ϵ0 = [0.1,0.3,1], following Johansen & Youdin (2007), which translate into the following range of surface dust-to-gas ratios (Lim et al. 2024): Z = Πϵ0/2 = [0.0025,0.0075,0.025]. Fragmentation velocities were chosen in the range of vfrag = [7×10⁻³, 1.5×10⁻²]cs (justified in Appendix B). Regarding the domain size, we relied on Zhu & Yang (2021) to estimate the wavelength of the fastest-growing modes. Information about the different models is gathered in Table 1.
Simulated models, with a 20482 resolution.
We focused on the impact of dust growth and mass loading on the saturation state of the SI by comparing simulations without growth (NGr), with growth but no mass loading (GrNML), and with growth and mass loading (GrML). Starting with an initial Stini = 0.1, dust growth is turned on when the saturation state of the SI is reached. Without mass loading, the dust distribution is expected to halt at a maximum Stfrag determined by the choice of vfrag. The correspondence between the two is given in Fig. B.1. If dust clumping is strong enough, the fragmentation barrier is expected to be pushed to a higher Stokes number (i.e., higher dust size) when mass loading is accounted for.
3. Results
We present in Fig. 1 the maximum dust-to-gas ratio as a function of time for different dust growth scenarios and two different fragmentation thresholds, with ϵ0 = 0.3. Figure 2 displays dust density maps in the saturation state of the SI. First of all, looking at the run without dust evolution NGr, we see that only modest density fluctuations occur because both ϵ0 and St are below unity, corresponding to model AA in Johansen & Youdin (2007). Including dust evolution in runs GrNML and GrML induces a striking rise in the maximum dust-to-gas ratio, owing to the increase in dust size, and thus St, triggering stronger SI. This increase is orders of magnitude greater for a higher fragmentation velocity, in agreement with the results of Ho et al. (2024). The impact of mass loading of dust particles differs depending on the chosen fragmentation velocity.
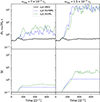 |
Fig. 1. Evolution of the maximum dust-to-gas ratio (top row) and maximum St (bottom row) with time for the different dust growth scenarios, NGr, GrNML, and GrML. The initial dust-to-gas ratio is ϵ0 = 0.3. |
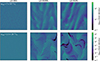 |
Fig. 2. Dust density maps. Each column corresponds to the given dust growth scenario, while each row has a given fragmentation velocity. |
3.1. Tightly coupled regime, Stfrag< 1
Considering the lower fragmentation velocity, vfrag = 7 × 10⁻³cs, the Stokes number of the dust grows to a fixed value of Stfrag ≃ 0.25 < 1 for the GrNML run, as is seen in Fig. 1 (and Fig. B.1). Accounting for mass loading, the GrML run reaches a higher  (that can be estimated with Eq. (6)). In this tightly coupled regime with Stfrag < 1, increasing the maximum St of the dust allows triggering of more intense modes, which is a known behavior of the SI (Youdin & Goodman 2005). Indeed, while the GrNML run reaches ρd, max/ρg ≃ 1, this value is enhanced to ∼3 in the GrML case.
3.2. Loosely coupled regime, Stfrag≥ 1
Considering now the higher fragmentation velocity, vfrag = 1.5 × 10⁻²cs, the Stokes number of the dust halts at Stfrag ≃ 1 for the GrNML run. Because of dust clumping, this value increases to  in the GrML run. While the SI is exacerbated when St → 1 due to a resonance effect (Youdin & Goodman 2005; Hopkins & Squire 2018), further decoupling of the dust actually leads to weaker density fluctuations. Indeed, although
  , the dust is now in a loosely coupled regime so its density is not further enhanced. Both runs GrNML and GrML lead to a maximum dust-to-gas ratio exceeding 100.
4. Discussion
4.1. Synergy between SI and dust growth
We identified two regimes controlled by the chosen value of fragmentation velocity. Since dust tensile properties are not tightly constrained (see Steinpilz et al. 2019; Gärtner et al. 2017; Musiolik 2021; Pillich et al. 2023; Morrissey et al. 2025) and dust surface composition varies across the radial extent of the disk, we cannot yet determine which specific coupling regime should be expected at each radius. However, it is clear that as long as fragmentation occurs for dust particles with Stfrag < 1, regardless of the source of collisions, mass loading in dust-rich regions should significantly reduce impact velocities, and thus shift the fragmentation barrier to higher sizes. In turn, this should cause filaments with higher dust density to form. Thus, there is a two-way synergy between dust clumping induced by the SI and dust growth. However, particularly resilient dust grains that have Stfrag ≥ 1 decouple from the SI, so do not further boost clumping, removing the two-way synergy.
4.2. Roche density and bouncing barrier
In the tightly coupled regime, mass loading enhances dust density fluctuations, reducing the gap between the peak density and that required for GI. However, the efficiency of this mechanism depends on the reservoir of solid particles. In Figs. D.1 and D.2, we vary the initial dust-to-gas ratio and show that a value of ϵ0 = 1 rapidly pushes the dust from Stfrag ≃ 1 to  along with a maximum dust-to-gas ratio close to ∼400. For an aspect ratio of (H/r) = 0.1 at r = 1 AU, and an Minimum Mass Solar Nebulae density profile given in Hayashi (1981), the Roche density is ρR = 9Ωk2/(4π𝒢) ≃ 374ρ, a rather high but reachable value. Note that with a different choice of (H/r) = 0.05 at r = 10 AU, we get ρR = 9Ωk2/(4π𝒢) ≃ 59ρ, which is a value that is already achievable without mass loading (Ho et al. 2024). Simulations with vertical gravity (to account for settling of large particles toward the disk midplane) and self-gravity are needed to assess the full potential of dust mass loading.
In Fig. E.1, we use the exact same approach but crudely explore the bouncing barrier by setting a lower initial Stini = 10−2 and a bouncing velocity threshold of vbouncing = 1.5 × 10⁻³cs, ten times lower than the fiducial vfrag, corresponding to less favorable conditions for the development of the SI. While the GrNML run for ϵ0 = 0.3 produces negligible dust clumping in this scenario, the GrML scenario stands out by showing some clumping, though more than an order of magnitude less than earlier runs. For ϵ0 = 0.1, no density enhancement is observed.
4.3. Radial drift
As St → 1, the drift timescale reaches a minimum and radial drift becomes a serious impediment to the formation of planetesimals (Armitage 2019; Birnstiel 2024). However, radial drift should be less efficient in dust clumps. Tominaga & Tanaka (2023) suggested that the increase in ϵ would compensate that of St such that drift velocities should not increase as dust growth proceeds. In addition, a high ϵ0 = 1 induces fast dust growth and the formation of decoupled particles with  due to mass loading (see Fig. D.1). In this case, drift velocities should decrease and radial drift should be less dramatic.
5. Conclusion
Through high-resolution simulations including a monodisperse treatment of dust growth, we have shown that dust clumping is boosted by dust coagulation as the Stokes number increases toward unity, suggesting a positive feedback loop. In addition, we have explored the impact of mass loading of dust particles onto the gas, which is significant in high-dust-density regions. This mechanism reduces impact velocities, and thus allows dust grains to survive to higher sizes, raising the fragmentation threshold. Depending on the velocity threshold for fragmentation, two regimes stand out:
-
If the fragmentation threshold is such that the Stokes number of fragmenting grains is Stfrag < 1, then mass loading increases it to higher values, resulting in enhanced dust density fluctuations, further bridging the gap to the onset of GI.
-
If the fragmentation threshold is such that Stfrag ≥ 1, then dust densities are already high and saturated. The shift in the fragmentation barrier has no impact on dust clumping. However, the enhanced
 from mass loading implies less efficient radial drift and turbulent diffusion of particles, which is favorable for the onset of GI (Klahr & Schreiber 2020).
While the initial dust size has little effect, the initial dust-to-gas ratio, ϵ0, controls the efficiency of mass loading, with a higher value implying lower impact velocities between dust particles. However, if the dust-to-gas ratio at the barrier considered (bouncing or fragmentation) is too low, the SI does not increase the dust-to-gas ratio enough for the mass loading to significantly shift the barrier. In conclusion, for low fragmentation velocities previously believed to be prohibitive, the onset of the GI, and thus the formation of planetesimals, should be facilitated by the two-way synergy between SI, dust growth, and mass loading.
Acknowledgments
V.V.-G. received support from the Annette Kade Graduate Student Fellowship Program of the RGGS. M.-M.M.L. is partly supported by NASA grant 80NSSC25K7117. We thank the ERC grant ECOGAL.
References
- Armitage, P. J. 2019, Saas-Fee Advanced Course, 45, 1 [NASA ADS] [CrossRef] [Google Scholar]
- Bai, X.-N., & Stone, J. M. 2010, ApJ, 722, L220 [Google Scholar]
- Benítez-Llambay, P., Krapp, L., & Pessah, M. E. 2019, ApJS, 241, 25 [Google Scholar]
- Birnstiel, T. 2024, ARA&A, 62, 157 [NASA ADS] [CrossRef] [Google Scholar]
- Blum, J. 2018, Space Sci. Rev., 214, 52 [NASA ADS] [CrossRef] [Google Scholar]
- Carrera, D., & Simon, J. B. 2022, ApJ, 933, L10 [NASA ADS] [CrossRef] [Google Scholar]
- Carrera, D., Johansen, A., & Davies, M. B. 2015, A&A, 579, A43 [NASA ADS] [CrossRef] [EDP Sciences] [Google Scholar]
- Carrera, D., Davenport, A., Simon, J. B., et al. 2025a, ApJ, 990, 39 [Google Scholar]
- Carrera, D., Lim, J., Eriksson, L. E. J., Lyra, W., & Simon, J. B. 2025b, A&A, 696, L23 [NASA ADS] [CrossRef] [EDP Sciences] [Google Scholar]
- Drazkowska, J. 2017, European Planetary Science Congress, EPSC2017 [Google Scholar]
- Epstein, P. S. 1924, Phys. Rev., 23, 710 [Google Scholar]
- Estrada, P. R., & Cuzzi, J. N. 2008, ApJ, 682, 515 [Google Scholar]
- Gärtner, S., Gundlach, B., Headen, T. F., et al. 2017, ApJ, 848, 96 [CrossRef] [Google Scholar]
- Goldreich, P., & Tremaine, S. 1978, ApJ, 222, 850 [NASA ADS] [CrossRef] [Google Scholar]
- Goldreich, P., & Ward, W. R. 1973, ApJ, 183, 1051 [Google Scholar]
- Hayashi, C. 1981, Prog. Theor. Phys. Suppl., 70, 35 [Google Scholar]
- Ho, K. W., Li, H., & Li, S. 2024, ApJ, 975, 975 [Google Scholar]
- Hopkins, P. F., & Squire, J. 2018, MNRAS, 480, 2813 [Google Scholar]
- Huang, P., & Bai, X.-N. 2022, ApJS, 262, 11 [NASA ADS] [CrossRef] [Google Scholar]
- Hühn, L. A., Dullemond, C. P., Lebreuilly, U., et al. 2025, A&A, 696, A162 [NASA ADS] [CrossRef] [EDP Sciences] [Google Scholar]
- Johansen, A., & Youdin, A. 2007, ApJ, 662, 627 [Google Scholar]
- Johansen, A., Jacquet, E., Cuzzi, J. N., Morbidelli, A., & Gounelle, M. 2015, Asteroids IV, 471 [Google Scholar]
- Kimura, H., Wada, K., Senshu, H., & Kobayashi, H. 2015, ApJ, 812, 67 [NASA ADS] [CrossRef] [Google Scholar]
- Klahr, H., & Schreiber, A. 2020, ApJ, 901, 54 [NASA ADS] [CrossRef] [Google Scholar]
- Lebreuilly, U., Vallucci-Goy, V., Guillet, V., Lombart, M., & Marchand, P. 2023, MNRAS, 518, 3326 [Google Scholar]
- Li, R., & Youdin, A. N. 2021, ApJ, 919, 107 [NASA ADS] [CrossRef] [Google Scholar]
- Li, R., Youdin, A. N., & Simon, J. B. 2019, ApJ, 885, 69 [NASA ADS] [CrossRef] [Google Scholar]
- Lim, J., Simon, J. B., Li, R., et al. 2024, ApJ, 969, 130 [NASA ADS] [CrossRef] [Google Scholar]
- Morrissey, L. S., Ebel, D. S., Eriksson, L. E. J., et al. 2025, ArXiv e-prints [arXiv:2511.04423] [Google Scholar]
- Musiolik, G. 2021, MNRAS, 506, 5153 [CrossRef] [Google Scholar]
- Ormel, C. W., & Cuzzi, J. N. 2007, A&A, 466, 413 [NASA ADS] [CrossRef] [EDP Sciences] [Google Scholar]
- Ormel, C. W., & Spaans, M. 2008, ApJ, 684, 1291 [NASA ADS] [CrossRef] [Google Scholar]
- Ormel, C. W., Paszun, D., Dominik, C., & Tielens, A. G. G. M. 2009, A&A, 502, 845 [NASA ADS] [CrossRef] [EDP Sciences] [Google Scholar]
- Paardekooper, S.-J., McNally, C. P., & Lovascio, F. 2020, MNRAS, 499, 4223 [CrossRef] [Google Scholar]
- Paardekooper, S.-J., McNally, C. P., & Lovascio, F. 2021, MNRAS, 502, 1579 [NASA ADS] [CrossRef] [Google Scholar]
- Pillich, C., Bogdan, T., Tasto, J., et al. 2023, Planet. Sci. J., 4, 195 [NASA ADS] [CrossRef] [Google Scholar]
- Rucska, J. J., & Wadsley, J. W. 2023, MNRAS, 526, 1757 [NASA ADS] [CrossRef] [Google Scholar]
- Sato, T., Okuzumi, S., & Ida, S. 2016, A&A, 589, A15 [NASA ADS] [CrossRef] [EDP Sciences] [Google Scholar]
- Schäfer, U., Yang, C.-C., & Johansen, A. 2017, A&A, 597, A69 [Google Scholar]
- Schaffer, N., Johansen, A., & Lambrechts, M. 2021, A&A, 653, A14 [NASA ADS] [CrossRef] [EDP Sciences] [Google Scholar]
- Schoonenberg, D., & Ormel, C. W. 2017, A&A, 602, A21 [NASA ADS] [CrossRef] [EDP Sciences] [Google Scholar]
- Schreiber, A., & Klahr, H. 2018, ApJ, 861, 861 [Google Scholar]
- Shakura, N. I., & Sunyaev, R. A. 1976, MNRAS, 175, 613 [NASA ADS] [CrossRef] [Google Scholar]
- Simon, J. B., Armitage, P. J., Li, R., & Youdin, A. N. 2016, ApJ, 822, 55 [Google Scholar]
- Squire, J., & Hopkins, P. F. 2018, MNRAS, 477, 5011 [Google Scholar]
- Steinpilz, T., Teiser, J., & Wurm, G. 2019, ApJ, 874, 60 [NASA ADS] [CrossRef] [Google Scholar]
- Stepinski, T. F., & Valageas, P. 1996, A&A, 309, 301 [NASA ADS] [Google Scholar]
- Tominaga, R. T., & Tanaka, H. 2023, ApJ, 958, 168 [Google Scholar]
- Tominaga, R. T., & Tanaka, H. 2025, ApJ, 983, 15 [Google Scholar]
- Tsukamoto, Y., Okuzumi, S., & Kataoka, A. 2017, ApJ, 838, 151 [NASA ADS] [CrossRef] [Google Scholar]
- Umurhan, O. M., Estrada, P. R., & Cuzzi, J. N. 2020, ApJ, 895, 4 [Google Scholar]
- Verrier, G., Lebreuilly, U., & Hennebelle, P. 2025, A&A, 701, A174 [NASA ADS] [CrossRef] [EDP Sciences] [Google Scholar]
- Villenave, M., Stapelfeldt, K. R., Duchêne, G., et al. 2022, ApJ, 930, 11 [NASA ADS] [CrossRef] [Google Scholar]
- Yang, C.-C., & Zhu, Z. 2021, MNRAS, 508, 5538 [NASA ADS] [CrossRef] [Google Scholar]
- Yang, C.-C., Johansen, A., & Carrera, D. 2017, A&A, 606, A80 [NASA ADS] [CrossRef] [EDP Sciences] [Google Scholar]
- Youdin, A. N., & Goodman, J. 2005, ApJ, 620, 459 [Google Scholar]
- Zhu, Z., & Yang, C.-C. 2021, MNRAS, 501, 467 [Google Scholar]
Appendix A: Momentum equations
We model a local patch of the protoplanetary disk centered on the midplane within the shearing box framework (Goldreich & Tremaine 1978). The local frame co-rotates with the disk at an angular velocity Ωe_z at an arbitrary distance r, where the x-axis is in the radial direction and the z-axis is vertical. The momentum conservation equations for the gas and the dust are:
![Mathematical equation: $$ \begin{aligned} \frac{\partial \rho _\mathrm{g} \mathbf v }{\partial t} + \nabla \cdot \left[ \rho _\mathrm{g} \mathbf v \mathbf v + P \mathbb{I} \right]&= -\rho _\mathrm{g} \left[2 \mathbf v \times \Omega \mathbf e_z + 2 q \eta \Omega ^2 r \mathbf e_x \right] + \mathbf F _\mathrm{drag} , \nonumber \\ \frac{\partial \rho _\mathrm{d} \mathbf v _\mathrm{d} }{\partial t} + \nabla \cdot \left[ \rho _\mathrm{d} \mathbf v _\mathrm{d} \mathbf v _\mathrm{d} \right]&= -2 \rho _\mathrm{d} \mathbf v _\mathrm{d} \times \Omega \mathbf e_z - \mathbf F _\mathrm{drag} , \end{aligned} $$](/articles/aa/full_html/2026/01/aa58000-25/aa58000-25-eq16.gif) (A.1)
(A.1)
where P = ρgcs2 is the locally isothermal equation of state. The aspect ratio of the disk is taken constant with radius and equal to (H/r) = 0.1 and q = 3. The dimensionless measure of sub-Keplerian rotation is expressed through η = Π(H/r) = 0.05(H/r).
SHARK relies on the monotonic-upstream-centered scheme for conservation laws predictor-corrector scheme to solve the Riemann problems at each cell interface. The gas fluid equations are solved using an HLLC approximate Riemann solver, while the dust fluid equations are solved with the solver presented in Huang & Bai (2022). Although it is more accurate to use a common wave fan for both the dust and the gas when the two are strongly coupled, it is no longer recommended when the relative velocities are high (i.e., when the decoupling scale is resolved, see Verrier et al. 2025). Since we study here dust decoupling and clumping, we use distinct wave fans with no sound wave for the dust fluid. The drag solver is the implicit one presented in Benítez-Llambay et al. (2019).
Appendix B: Fragmentation velocity, domain size, and grain intrinsic density
In order to set realistic values of fragmentation velocities, we obtain physical estimates of the sound speed at r = 1 AU with a central star of mass M = 1 M⊙. With vk = rΩ = (𝒢M/r)1/2 and our chosen aspect ratio of H/r = 0.1, we find cs ≃ 3 × 105 cm s−1. A widely used value for the fragmentation threshold of bare silicate grains can be found in Ormel et al. (2009), where vfrag = 21.2 m s−1 = 7 × 10⁻³cs, while for ice-coated grains vfrag = 424.3 m s−1 = 1.4 × 10⁻¹cs. However, recent laboratory experiments revised the dust elastic properties and found that bare silicate grains are more resilient than previously believed (Kimura et al. 2015; Steinpilz et al. 2019). We thus take vfrag = 7 × 10⁻³cs as a lower limit and explore higher values, in the range vfrag = [7 ×10−3,1.5 ×10−2]cs.
We show in Fig. B.1 the correspondence between the dust collision velocity driven by turbulence with respect to the Stokes number St of the larger grain, as predicted by the analytical model of Ormel & Cuzzi (2007), without mass loading. The collision velocity is given by:
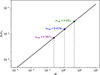 |
Fig. B.1. Dust collision velocity driven by turbulence with respect to the Stokes number St of the larger grain, as predicted by the analytical model of Ormel & Cuzzi (2007), without mass loading. The colored circles refer to the fragmentation velocity values explored in this work. The maximum St to which the dust distribution is expected to grow can be inferred. With mass loading, this limit can be increased. |
![Mathematical equation: $$ \begin{aligned} \Delta v_{{i,j}} = V_\mathrm{g} \left(\beta {\left[x_{i,j}\right]} \mathrm{St} _i\right)^{1/2}, \end{aligned} $$](/articles/aa/full_html/2026/01/aa58000-25/aa58000-25-eq17.gif) (B.1)
(B.1)
where i and j are the indices of the two colliding grains. For equal-size grains
 (B.2)
(B.2)
With mass loading, the lower effective sound speed  (Eq. 4) is substituted in Eq. (B.2). In regions where the dust-to-gas ratio ϵ is enhanced, the sound speed is effectively reduced and thus so are the turbulent collision velocities. As a consequence, higher dust sizes and St can be reached before fragmentation occurs.
Regarding the domain size, we rely on Zhu & Yang (2021) to estimate the wavelength of the fastest growing modes. When ϵ0 ≥ 1, they find that the corresponding dimensionless wavenumber is Kx ≃ Kz ≥ 10Ka0 where
 (B.3)
(B.3)
as defined in Squire & Hopkins (2018), reaches a minimum at St = 1 + ϵ. Ka0 is Ka with ϵ = 0. We thus use Kx ≃ Kz = 10Ka0 and set the domain size to Lx = Lz = 3λx = 3(2π/Kx) = 3(0.031)H = 0.094H. When ϵ0 < 1, Kx ∼ Ka0 and thus Lx = Lz = 3λx = 0.94H. The low numerical cost of the monodisperse approach for the treatment of dust growth allows us to work with a high resolution of Nx = Nz = 2048 cells.
In this work, the Stokes number St of solid particles is determined directly by the dust size sd, and thus varies accordingly as particles grow. We make the assumption that the intrinsic density ρgr is kept fixed during the simulations, which is worth commenting on. Indeed, the grain intrinsic density is an important parameter whose effect is twofold. First, it controls the number density nd ∝ ρgr−1 of solid particles. For a given dust size, a higher intrinsic density implies fewer particles which in turn tends to increase the coagulation timescale (see Eq. 2) and thus reduce growth rates. Second, this parameter is involved in the definition of St via the stopping time ts ∝ ρgr. An increased intrinsic density means a higher inertia and thus a weaker coupling to gas molecules. It follows that the Stokes number St and thus the turbulent induced collision velocities should be higher (for a given dust size). However, we note that the overall effect of a higher ρgr is to increase the coagulation timescale  , i.e., to slow down dust growth. Conversely, a fractal growth leading to a decreasing intrinsic density would proceed faster. As already mentioned, St ∝ ρgr for a given dust size. As a consequence, compaction of dust grains upon collision should gradually enhance collision velocities (see Eq. B.1). However, our results should be unaffected since we work directly with the dimensionless St. The only difference is that the Stokes number should follow a different evolutionary path as both grain size and intrinsic density evolve over time, but fragmentation is expected to occur anyway at the threshold Stfrag defined by the choice of vfrag (which depends on the dust elastic properties and shape). In protoplanetary disks, pebbles close to the fragmentation barrier are expected to have already gone through compaction, at about sd ∼ mm for bare-silicate grains and sd ∼ cm for ice-coated grains (Blum 2018). Nevertheless, this point should be more relevant and thus addressed for dust grain evolution prior to the bouncing barrier, where dust growth could be fractal.
Appendix C: Validation tests
We provide a test of the code by running SI simulations with a single dust species of fixed Stokes number and specific initial dust-to-gas ratio corresponding to the models defined in Johansen & Youdin (2007) AB, with St = 0.1 and ϵ0 = 1 and BA, with St = 1 and ϵ0 = 0.2. As in Fig. 11 of Benítez-Llambay et al. (2019), we compare the maximum dust density divided by initial dust-to-gas ratio as a function of time for various resolutions. Our results agree well with theirs: Fig. C.1 shows continued growth in the maximum value with increasing resolution for the AB test, while Fig C.2 shows convergence at values below 103 for the BA test. Ne note only slight discrepancies in terms of maximum dust density at very low resolutions,x presumably due to the use of different drag and Riemann solvers. Again in agreement with Benítez-Llambay et al. (2019), growth rates prior to saturation also increase with resolution in the AB case, but not in the BA case for Nx ≥ 512.
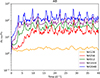 |
Fig. C.1. Maximum dust density divided by initial dust-to-gas ratio as a function of time for different spatial resolutions for the AB model defined in Johansen & Youdin (2007): fixed St = 0.1 and ϵ0 = 1. |
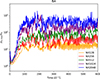 |
Fig. C.2. Same as Fig. C.1 but for the BA model defined in Johansen & Youdin (2007): fixed St = 1 and ϵ0 = 0.2. |
Appendix D: Impact of the initial dust-to-gas ratio, ϵ0
We explore here the influence of the initial dust-to-gas ratio, by comparing a lower value ϵ0 = 0.1 to a higher value ϵ0 = 1, with fixed fragmentation velocity vfrag = 1.5 × 10⁻²cs. For this value of vfrag, we saw in Sect. 3.2 that any increase in the Stokes number beyond the limit Stfrag ≥ 1 does not produce stronger dust density fluctuations due to efficient decoupling of the dust fluid, which is confirmed in Fig. D.1 for both values of ϵ0. The effect of changing ϵ0 is threefold. First, a higher value implies a stronger shift of the fragmentation barrier due to the dust fluid being more massive and thus significantly reducing the effective sound speed of the mixture. Indeed, the shifted barrier lies around  for ϵ0 = 0.1 but climbs to
  for ϵ0 = 1. Second, dust growth rates are increased for larger ϵ0 (see Eq. 2) where we see in Fig. D.1 that the Stokes number rises by two orders of magnitude in barely 50 orbital times for ϵ0 = 1 while more than 50 orbital times are needed to reach the fragmentation barrier for ϵ0 = 0.1. Finally, the SI is known to generate stronger dust clumping as ϵ0 increases, as depicted in Fig. D.1.
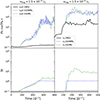 |
Fig. D.1. Evolution of the maximum dust-to-gas ratio (top row) and St (bottom row) with time for the different dust growth scenarios NGr, GrNML, and GrML. The models in the left column use an initial dust-to-gas ratio of ϵ0 = 0.1 while in the right column they use ϵ0 = 1. The velocity fragmentation threshold vfrag = 1.5 × 10⁻²cs in both cases. |
In Fig. D.2, we present the time-averaged probability density function (PDF) of dust-to-gas ratio in the saturated regime for different sets of parameters. As already suggested by the time evolution of the maximum value in Figs. 1 and D.1, we see that the runs with dust growth (GrNML and GrML) produce a strikingly larger dispersion of dust-to-gas ratio. In addition, for vfrag = 7 × 10⁻³cs, mass loading (GrML) leads to a higher occurrence of larger values than the GrNML run. In contrast, the right-hand tail of the distributions are overlapping for both runs when vfrag = 1.5 × 10⁻²cs, confirming that the decoupled grains do not further enhance density fluctuations.
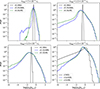 |
Fig. D.2. Time-averaged PDF of the dust-to-gas ratio in the saturated regime of the SI for different values of initial dust-to-gas ratio ϵ0 and fragmentation velocity vfrag. Different dust growth scenarios are explored: NGr, GrNML, and GrML. |
Appendix E: A glimpse at the bouncing barrier
This particular case explores the conditions associated with the bouncing barrier by considering Stini = 10−2 and a bouncing velocity vbouncing = 1.5 × 10⁻³cs with a value ten times lower than the fiducial vfrag. With the lower value ϵ0 = 0.1, we see that almost no dust clumping is produced even with mass loading, due to the maximum St remaining low. However, a larger value of ϵ0 = 0.3 allows the dust density to soar in the mass loading (GrML) run, reaching a value close to ϵ ≃ 5 as the effective Stokes number grows to  . This situation clearly highlights the important role of the initial dust-to-gas ratio ϵ0.
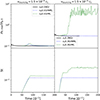 |
Fig. E.1. Same as Fig. D.1 but starting from a lower initial Stokes number Stini = 10−2 with a bouncing barrier set at the value vfrag = 1.5 × 10⁻³cs. The left column corresponds to an initial dust-to-gas ratio of ϵ0 = 0.1 whereas the right column corresponds to ϵ0 = 0.3. |
Appendix F: How the Stokes number and the dust-to-gas ratio correlate
Figure F.1 shows the bivariate PDF of the Stokes number St of the dust fluid and the dust-to-gas ratio ρd/ρg, 0 for different combinations of initial dust-to-gas ratio ϵ0 and fragmentation velocity vfrag, with dust growth and dust mass loading (GrML).
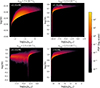 |
Fig. F.1. Bivariate PDF of the Stokes number St of the dust fluid and the dust-to-gas ratio ρd/ρg, 0 for different values of initial dust-to-gas ratio ϵ0 and fragmentation velocity vfrag. |
As expected, there is a clear correlation between both quantities for vfrag = 7 × 10⁻³cs, when  , since in this loosely coupled regime, higher values of St yield stronger dust density fluctuations (see Fig. 1). However, for the higher fragmentation velocity vfrag = 1.5 × 10⁻²cs, the fragmentation barrier is reached at
  and the coupling between dust growth and clumping is only one way because particles with St above unity decouple from the gas. Overdensities promote dust growth, but in turn, the larger dust grains formed do not produce stronger density fluctuations via the SI. This is reflected in the PDF as we see that for vfrag = 1.5 × 10⁻²cs, the counts are more uniform for most of the combination of values, and the more likely values show that a large range of dust-to-gas ratio can be associated with the same Stokes number.
All Tables
All Figures
|
Fig. 1. Evolution of the maximum dust-to-gas ratio (top row) and maximum St (bottom row) with time for the different dust growth scenarios, NGr, GrNML, and GrML. The initial dust-to-gas ratio is ϵ0 = 0.3. |
| In the text | |
|
Fig. 2. Dust density maps. Each column corresponds to the given dust growth scenario, while each row has a given fragmentation velocity. |
| In the text | |
|
Fig. B.1. Dust collision velocity driven by turbulence with respect to the Stokes number St of the larger grain, as predicted by the analytical model of Ormel & Cuzzi (2007), without mass loading. The colored circles refer to the fragmentation velocity values explored in this work. The maximum St to which the dust distribution is expected to grow can be inferred. With mass loading, this limit can be increased. |
| In the text | |
|
Fig. C.1. Maximum dust density divided by initial dust-to-gas ratio as a function of time for different spatial resolutions for the AB model defined in Johansen & Youdin (2007): fixed St = 0.1 and ϵ0 = 1. |
| In the text | |
|
Fig. C.2. Same as Fig. C.1 but for the BA model defined in Johansen & Youdin (2007): fixed St = 1 and ϵ0 = 0.2. |
| In the text | |
|
Fig. D.1. Evolution of the maximum dust-to-gas ratio (top row) and St (bottom row) with time for the different dust growth scenarios NGr, GrNML, and GrML. The models in the left column use an initial dust-to-gas ratio of ϵ0 = 0.1 while in the right column they use ϵ0 = 1. The velocity fragmentation threshold vfrag = 1.5 × 10⁻²cs in both cases. |
| In the text | |
|
Fig. D.2. Time-averaged PDF of the dust-to-gas ratio in the saturated regime of the SI for different values of initial dust-to-gas ratio ϵ0 and fragmentation velocity vfrag. Different dust growth scenarios are explored: NGr, GrNML, and GrML. |
| In the text | |
|
Fig. E.1. Same as Fig. D.1 but starting from a lower initial Stokes number Stini = 10−2 with a bouncing barrier set at the value vfrag = 1.5 × 10⁻³cs. The left column corresponds to an initial dust-to-gas ratio of ϵ0 = 0.1 whereas the right column corresponds to ϵ0 = 0.3. |
| In the text | |
|
Fig. F.1. Bivariate PDF of the Stokes number St of the dust fluid and the dust-to-gas ratio ρd/ρg, 0 for different values of initial dust-to-gas ratio ϵ0 and fragmentation velocity vfrag. |
| In the text | |
Current usage metrics show cumulative count of Article Views (full-text article views including HTML views, PDF and ePub downloads, according to the available data) and Abstracts Views on Vision4Press platform.
Data correspond to usage on the plateform after 2015. The current usage metrics is available 48-96 hours after online publication and is updated daily on week days.
Initial download of the metrics may take a while.