| Issue |
A&A
Volume 706, February 2026
|
|
|---|---|---|
| Article Number | A167 | |
| Number of page(s) | 25 | |
| Section | Planets, planetary systems, and small bodies | |
| DOI | https://doi.org/10.1051/0004-6361/202555916 | |
| Published online | 11 February 2026 | |
Refractive indices of photochemical haze analogs for Solar System and exoplanet applications: A cross-laboratory comparative study between the PAMPRE and COSmIC experimental setups
1
University of Paris Saclay, CNRS, LATMOS, OVSQ,
11 Boulevard d’Alembert,
78280
Guyancourt,
France
2
Ludwig Maximilian University, Faculty of Physics, Observatory of Munich,
Scheinerstrasse 1,
Munich
81679,
Germany
3
ETH University, Center for Origin and Prevalence of Life, Department of Earth and Planetary Sciences,
8092
Zurich,
Switzerland
4
NASA Ames Research Center, Space Science and Astrobiology Division, Code ST, Moffett Field,
CA
94035,
USA
5
LISA, Université Paris Est Creteil and Université Paris Cité, CNRS,
94010
Créteil,
France
6
Ecole Polytechnique, LPICM,
Route de Saclay,
91120
Palaiseau,
France
7
Synchrotron SOLEIL, L’Orme des Merisiers,
91190
Saint-Aubin,
France
8
GSMA, Université de Reims Champagne-Ardenne, CNRS,
51687
Reims,
France
★ Corresponding author: This email address is being protected from spambots. You need JavaScript enabled to view it.
Received:
12
June
2025
Accepted:
24
October
2025
Abstract
Previous observations of Titan, Pluto, and Solar System gas giants, along with recent observations of exoplanet atmospheres with the James Webb Space Telescope, have taught us that photochemical hazes are ubiquitous and form in a variety of temperature, gas composition, and irradiation environments. Despite their crucial role in understanding their impact on observations and on the planetary radiative budget, the refractive indices of these haze particles remain unknown and are strongly influenced by changes in gas-phase chemistry. In this study, we performed a cross-laboratory investigation to assess the effect of the experimental setup and gas composition on the refractive indices of Titan, Pluto, and exoplanet haze analogs. We report new data in a broad spectral range from UV to far-IR (up to 200 μm) for future use in climate models and retrieval frameworks. We compare the refractive indices of laboratory haze analogs produced from six different gas compositions, in which we varied the relative abundances N2/CH4 and CH4/CO in the initial gas mixture, using the PAMPRE (LATMOS, France) and COSmIC (NASA Ames Research Center, USA) experimental setups. We observed strong variations in the k values in the spectral range from UV to near-IR between the different analogs, which are caused by both the experimental setup and changes in the gas N2/CH4 ratio. We find that the gas N2/CH4 ratio has a stronger influence on the haze refractive indices in the entire spectral range compared to the gas CH4/CO ratio. The experimental setup is the primary factor affecting the refractive indices, confirming that the gas residence time, irradiation, pressure, and gas temperature are important parameters influencing the composition of the solid analog. The higher n and k values in the UV-visible range, along with the stronger amine, alkene, aromatic, and/or hetero-aromatic signatures in the mid-IR for the COSmIC analogs, are consistent with a greater incorporation of nitrogen into the COSmIC solid analogs compared to the PAMPRE analogs, even at similar nitrogen abundances in the gas phase. Haze analogs produced in gas mixtures without nitrogen, similar to the stratospheres of Solar System gas giants and the H2-dominated atmospheres of sub-Neptunes, are generally more transparent with lower n values across the entire spectral range from UV to mid-IR and should therefore be carefully considered in climate and observational applications. The variations in IR absorption features between hazes produced with and without nitrogen could help constrain the presence of N2 in exoplanet atmospheres.
Key words: planets and satellites: atmospheres / planets and satellites: gaseous planets / planets and satellites: terrestrial planets
© The Authors 2026
 Open Access article, published by EDP Sciences, under the terms of the Creative Commons Attribution License (https://creativecommons.org/licenses/by/4.0), which permits unrestricted use, distribution, and reproduction in any medium, provided the original work is properly cited.
This article is published in open access under the Subscribe to Open model. This email address is being protected from spambots. You need JavaScript enabled to view it. to support open access publication.
1 Introduction
Photochemical hazes are ubiquitous in the atmospheres of the different objects in the outer Solar System (Kim et al. 1991; Ortiz et al. 1996; Wong et al. 2003; Gladstone et al. 2016; Hörst 2017; Mills et al. 2021; Sánchez-Lavega et al. 2023), as well as in exoplanet atmospheres (Gao et al. 2021). Their formation is triggered by complex radical organic chemistry mainly driven by vacuum ultraviolet (VUV) photons in the upper layers of planetary atmospheres, but may also occur via energetic cosmic rays (e.g., suggested for Pluto’s dark surface material, Krasnopolsky (2020)) and electrons accelerated in planetary magnetospheres (e.g., Jupiter’s polar hazes and Titan hazes, Wilson & Atreya 2004, Wong et al. 2003). The chemical pathways leading to haze formation and controlling the composition of the resulting solid material remain largely unknown, posing the main limitation to numerically reproducing this essential piece of the atmospheric physico-chemical structure. Insights into the gas-phase haze precursors, solid composition, and optical properties primarily rely on laboratory experiments, which provide crucial data to support modeling efforts and help interpret observations.
Laboratory experiments revealed that hazes form under a broad variety of gas compositions, including CH4 - (e.g., Khare et al. 1984 and Imanaka et al. 2004), CO2 - (Trainer et al. 2004a; Gavilan et al. 2018), CO- (Hörst & Tolbert 2014), and H2O-rich (He et al. 2018) mixtures. The formation pathways and gas-phase precursors are known to vary with the gas composition, for instance transitioning between aliphatic and polycyclic aromatic hydrocarbon pathways depending on the methane abundance (Trainer et al. 2004b). In N2-dominated gas mixtures representative of Titan and Pluto’s atmosphere, the photochemical buildup of nitrile chains contributes significantly to the formation of these aerosols (Khare et al. 1994; Gautier et al. 2011; Sciamma-O’Brien et al. 2014; Hörst et al. 2018; Perrin et al. 2021, 2025). Ion chemistry also leads to the formation of charged hydrocarbon and nitrile compounds acting as precursors to these haze particles during their formation in the ionosphere (Vuitton et al. 2009; Dubois et al. 2020). The composition of the solid analog is strongly affected by gas-phase chemistry; it is thus controlled not only by the initial gas composition but also by the experimental conditions, i.e., pressure, gas temperature, and irradiation efficiency (Sciamma-O’Brien et al. 2014; Jovanovic et al. 2020; Carrasco et al. 2016; Nuevo et al. 2022). A general framework has yet to be established in order to link the gas-phase chemistry to the composition and production rate of haze particles under a variety of atmospheric environments. This solid composition must, however, be considered carefully as it significantly affects the optical properties of the haze particles and thus strongly impacts observations of planetary atmospheres (see reviews of Brassé et al. 2015 and Sciamma-O’Brien et al. 2024).
In radiative transfer models, the haze composition is accounted for using the material’s complex refractive index, with the real part, n, describing the dispersion of light and the imaginary part, k, quantifying absorption. These refractive indices are intrinsic properties controlled by the chemical composition and thus independent of the particle’s size and shape. Khare et al. (1984) provided the first refractive indices of laboratory-generated haze analogs for a Titan-like gas mixture with 90% N2 and 10% CH4. This pioneer dataset is widely used in the community for its broad spectral range and has never been reproduced to this day. Currently, several groups are able to produce laboratory haze analogs and measure their refractive indices. Among them, we identify the NASA Ames group with the COSmIC setup (Sciamma-O’Brien et al. 2023), the John Hopkins group with the PHAZER setup (He et al. 2022a, 2024), the LATMOS group with the PAMPRE setup (Sciamma-O’Brien et al. 2012; Mahjoub et al. 2012; Gavilan et al. 2017; Jovanovic et al. 2021; Drant et al. 2024), and the Colorado group (Hasenkopf et al. 2010; Ugelow et al. 2017, 2018; Reed et al. 2023). This massive work over the past decades has revealed that the refractive indices of haze analogs are strongly influenced not only by the initial gas composition but also by the properties of the setup itself (Brassé et al. 2015; Sciamma-O’Brien et al. 2024). The lack of cross-laboratory comparative studies limits our understanding of the effect of the setup as each group focuses on different gas compositions. In addition, currently available data are often limited to the UV-visible and near-infrared (NIR) spectral range (Ramirez et al. 2002; Tran et al. 2003; Mahjoub et al. 2012; Sciamma-O’Brien et al. 2012; Gavilan et al. 2017; He et al. 2022a; Sciamma-O’Brien et al. 2023). Both climate calculations and data analysis of spectroscopic observations rely on refractive indices at longer wavelengths, especially in the era of the James Webb Space Telescope (JWST) operating exclusively in the IR.
Observations of Titan, Pluto, Solar System gas giants, and exoplanets have revealed a significant influence of photochemical hazes (Baines et al. 2005; Kim et al. 2011; Stern et al. 2015; Gao et al. 2021). The imaginary part of the refractive index of the haze could be retrieved from the various Cassini-Huygens observations of Titan (Rannou et al. 2010; Vinatier et al. 2012; Rannou et al. 2022). Comparison to laboratory analogs helped constrain the composition of the solid material. Although observations of Titan hazes at short wavelengths (UV-NIR) suggest a high incorporation of nitrogen in the solid (Sciamma-O’Brien et al. 2023), their mid-infrared (MIR) features show no evidence of nitrogen and rather point to a solid rich in carbon and hydrogen (Bellucci et al. 2009; Kim et al. 2011; Vinatier et al. 2012; Kim & Courtin 2013; Kim et al. 2018). The observations of Pluto’s surface, which revealed a strong heterogeneity in the geological terrains, point to the presence of photochemical hazes mixed within ice particles (Stern et al. 2015; Olkin et al. 2017; Grundy et al. 2018; Gladstone & Young 2019; Scipioni et al. 2021; Lauer et al. 2021; Fayolle et al. 2021). The analysis of these observations is also strongly dependent on the refractive index data used for the haze particles (Protopapa et al. 2020), which could be different from Titan hazes following the presence of CO, as suggested by the data in Jovanovic et al. (2021). Hazes are also observed in the Solar System gas giants, produced from a gas composition poor in nitrogen and thus rich in carbon and hydrogen compared to Titan and Pluto. Refractive index data are critically lacking for these conditions even though they are expected to differ significantly from N-rich hazes (Khare et al. 1987). Early observations of exoplanet atmospheres with the Hubble Space Telescope in the visible-NIR revealed evidence of scattering induced by high-altitude aerosols (Ohno & Kawashima 2020; Gao et al. 2021). Expected as the main form of aerosols in exoplanetary atmospheres with temperatures < 1000 K (Gao et al. 2020), photochemical hazes strongly influence the thermal profile by heating the upper atmosphere and cooling the lower atmosphere (Lora et al. 2018; Lavvas & Arfaux 2021) to an extent partially controlled by the imaginary refractive index k (Adams et al. 2019; Lavvas & Arfaux 2021; Steinrueck et al. 2023). Modeling and data analysis are thus sensitive to these laboratory data that remain largely unknown for the various conditions expected in exoplanetary environments.
In the present work, we aim to assess the influence of the gas composition and experimental setup on the refractive indices of haze analogs in a broad spectral range from UV to far-infrared (FIR). We cover a wide range of gas compositions to characterize the effect of N2 and CO, as well as to provide state-of-the-art data for Titan, Pluto, Jupiter, and exoplanet applications. The different gas compositions and experimental setups used for the production of our haze analogs are described in Section 2. Sections 3 and 4 present the measurements and models used to derive the refractive indices from UV to FIR. The results are summarized in Section 5 along with implications for observation and modeling studies.
2 Production of laboratory haze analogs
2.1 Comparative study of different gas compositions
We produced haze analog samples using various gas compositions to mimic the atmospheres of Titan, Pluto, Solar System gas giants (e.g., Jupiter), and exoplanets. Table 1 summarizes the six different gas mixtures used, where we varied the relative abundances N2/CH4 and CH4/CO.
Summary of the different haze analogs produced with the PAMPRE and COSmIC setups using different gas compositions.
The Titan analogs were produced from initial gas mixtures made of N2 and CH4. Previous work has shown that the nitrogen abundance in the gas phase can strongly influence the refractive indices of the solid analogs from UV to NIR (Mahjoub et al. 2012; Sciamma-O’Brien et al. 2023). We thus considered two different cases where we only varied the gas relative abundance N2/CH4 to assess the influence on the solid analog refractive indices from UV to FIR. The Titan 1 experiment reproduces the gas composition chosen by Khare et al. (1984) in their pioneering work whereas the Titan 2 conditions, with a higher N2/CH4, match the abundances observed in Titan’s atmosphere (Niemann et al. 2005, 2010; Gautier et al. 2024).
For the Pluto analog, we added 500 ppm of CO in the N2–CH4 gas mixture following the known abundances in Pluto’s atmosphere previously constrained by observations with the Very Large Telescope (Lellouch et al. 2011) and the Atacama Large Millimeter/Submillimeter Array (Lellouch et al. 2017). Comparison between the Titan 2 and Pluto analog refractive indices is crucial to understand the effect of CO and predict variations between the optical properties of Titan and Pluto aerosols.
For the first exoplanet analog (Exoplanet 1, Table 1), we further decreased the relative CH4/CO gas abundance to reproduce the lower C/O environments expected in exoplanet atmospheres (e.g., Liggins et al. 2020 or Liggins et al. 2023). Previous investigations focused on the effect of the CH4/CO2 gas relative abundance (Gavilan et al. 2017, 2018; Drant et al. 2024) since this molecular pair likely prevailed in the atmosphere of early Earth (Arney et al. 2016) and could encode a biotic origin of methane in exoplanet atmospheres (Mikal-Evans 2022). On the other hand, the CO–CH4 pair is expected in rocky exoplanet atmospheres, produced from a reduced planetary interior via outgassing (Liggins et al. 2023; Tian & Heng 2024; Drant et al. 2025), as well as in the H2-dominated atmospheres of sub-Neptunes (Wogan et al. 2024; Shorttle et al. 2024). A CH4/CO gas relative abundance of 4 was chosen for the Exoplanet 1 analog, equivalent to the previous CH4/CO2 ratio used in Drant et al. (2024), to directly compare the effect of CO versus CO2 on the refractive indices of haze analogs produced in N2-dominated gas mixtures. variations in chemical pathways and gas-phase haze precursors were expected between CO- and CO2-rich mixtures in response to the strong differences in their photodissociation efficiency. Previous investigations by Hörst & Tolbert (2014) suggested that CO plays a key role in the production and growth rate of haze particles; the influence on the refractive indices, however, is yet to be explored.
Finally, two additional exoplanet analogs were produced to mimic the N-poor environments found in the upper atmosphere of Jupiter and expected in most exoplanet sub-Neptunes (Madhusudhan et al. 2023; Wogan et al. 2024). For these analogs (Exoplanet 2 and 3 in Table 1), the gas compositions are similar to the Titan 2 and Exoplanet 1 cases with Ar replacing N2 as the dominant gas. The inert Ar gas was chosen for its molar mass, which is closer to N2 than He or H2, and for its resulting effect on the properties of the plasma discharge. We aimed to avoid strong variations in the electron energy distribution between the six different experiments; therefore, we chose not to use H2 plasmas, which are known for their highly energetic properties. The purpose of the Exoplanet 2 and Exoplanet 3 samples is to obtain the refractive indices of pure C–H–O hazes formed from hydrocarbon gas precursors without the contribution of nitriles. A comparison between the Titan 2 and Exoplanet 2 samples will further help us understand the effect of N2 on the refractive indices of photochemical haze analogs. Exoplanet atmospheres, such as sub-Neptunes, and the Solar System gas giants are H2 dominated, a molecule that likely contributes to the chemistry and may, for instance, modify the C/H ratio of the hazes generated. Khare et al. (1987) showed that the imaginary part of the complex refractive index is affected by the abundance of H2 relative to CH4. Future work will provide additional data for hazes produced in H2-dominated gas mixtures that will be compared to the reference data provided in this study in the absence of H2.
2.2 Comparative study of different experimental setups
The PAMPRE and COSmIC facilities based at LATMOS (France) and NASA Ames (USA), respectively, were used to produce analogs from similar gas compositions (see Table 1). The PAMPRE (French acronym for production of aerosols in microgravity by a reactive plasma) setup described in detail in Szopa et al. (2006) was designed to produce Titan aerosol analogs. A 13.56 MHz radio-frequency (RF) plasma discharge sustained with a power of 30 W enables the dissociation and ionization of the main gas molecules (N2 and CH4 for Titan) via electron impact. This initiates a complex radical chemistry similar to the one driven by VUV photons in the upper layers of planetary atmospheres. The properties of the plasma source were characterized in detail through experimental measurements and modeling, which revealed that the electron energy distribution is relatively similar to the Solar spectrum with a more significant contribution at high energies boosting dissociation and ionization mechanisms (Alves et al. 2012). The gas mixture (e.g., 95% N2–5% CH4 for the Titan 2 conditions, see Table 1) is injected continuously in the PAMPRE chamber at a controlled flow rate of 55 sccm (standard cubic centimeter per minute). A pumping system is connected to the chamber to stabilize the pressure around 1 hPa. In these conditions, the initial species and the chemical products remain in the reactive medium for ≈ 30 s before being pumped out of the chamber. We refer to this parameter as the gas residence time. The low-pressure environment prevents strong temperature variations within the reactive medium (Alcouffe et al. 2010). Chemical reactions therefore occur at room temperature. A steel-aluminum cage is placed around the upper electrode of the PAMPRE chamber to confine the plasma in a smaller volume. We placed optical windows and silicon wafers at the bottom of the cage, which here acted as the grounded electrode. During the experiment, the proximity to the reactive medium allowed the growth of an organic film directly onto the window and wafer acting as the sample substrates. The samples were exposed to the atmosphere for a short time during collection at the end of the experiment. Fig. 1 (top) shows the inside of the cage at the end of the experiment with the different substrates now covered by an organic film. After collection, the samples were kept in a glove box filled with pure N2(O2: 0.1. ppm, H2O: 1 ppm). Finally, the PAMPRE chamber was pumped to a secondary vacuum (≈ 10−6 hPa), and the walls were heated to remove water vapor and prevent contamination for the next experiment.
Main differences between the PAMPRE and COSmIC experimental conditions.
The COsmic SImulation Chamber (COSmIC) facility described in Sciamma-O’Brien et al. (2014) and Salama et al. (2018) was designed to study the solid and gas-phase chemistry for applications to planetary and astrophysical environments. The chosen gas mixture is injected in the chamber at a rate of 2000 sccm under atmospheric pressure and at room temperature. The gas flows through a thin slit (127 μm × 10 cm) using a pulse of 1.28 ms creating a supersonic jet expansion cooling the temperature adiabatically to ≈ 150 K and reducing the pressure to ≈ 30 hPa. In the stream of the expansion, a pulsed direct-current (DC) plasma discharge is created along the slit to trigger dissociation of the main gas species and initiate chemical reactions leading to the formation of haze analogs. Spectroscopic measurements in emission confirmed that the temperature remains at 200 K in the plasma discharge (Sciamma-O’Brien et al. 2017). The supersonic speed of the gas limits the residence time to ≈ 3 μs in the reactive medium, which is still sufficient to produce small organic particles with sizes ranging from 20 to 500 nm depending on the initial gas composition (Sciamma-O’Brien et al. 2017; Gavilan Marin et al. 2020; Sciamma-O’Brien & Salama 2020). These small particles are transported by the jet expansion and deposited onto the optical windows and silicon wafers placed vertically on the walls, 5 cm downstream of the electrodes. The continuous stacking of particles at jet speed onto the windows and wafers creates a film-like layer similar to the analogs produced in the PAMPRE setup. Fig. 1 (bottom) shows the COSmIC samples collected at the end of the Titan 2 experiment.
The main differences between the experimental conditions of PAMPRE and COSmIC are summarized in Table 2. The variations in temperature, pressure, plasma discharge (irradiation efficiency), and gas residence time affect chemistry and, more specifically, the formation of gas-phase haze precursors. As a result, differences in composition and thus optical properties are expected between the PAMPRE and COSmIC analogs. Our aim is to quantify these variations with the refractive indices (n and k) used as input parameters in radiative transfer calculations.
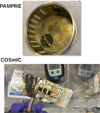 |
Fig. 1 Images of the Titan haze analogs produced with the PAMPRE (top) and COSmIC (bottom) setups from a mixture of 95% N2 and 5% CH4. The analog organic material is deposited onto MgF2 windows and silicon wafers. |
3 Measurements on the haze analogs from UV to far-IR
Various spectroscopic and ellipsometric measurements were carried out in the range from UV to FIR to obtain highly reliable data, and to optimize the data analysis and the accuracy of the retrieved refractive indices. The haze analogs were characterized using four types of measurements: UV-visible-NIR transmission spectroscopy, UV-visible-NIR reflection spectroscopy, UV-visible reflection ellipsometry, and IR transmission spectroscopy. Table 1 lists the measurements performed on each analog.
3.1 Transmission spectroscopy in the UV-visible-NIR
The transmission measurements were performed using the PerkinElmer Lambda 1050+ High Resolution Spectrophotometer based at LATMOS in Guyancourt (France) and operating from UV to NIR. We used the Three Detector Module designed for transmission measurements. It combines both photomultiplier and InGaAs detectors to cover a broad spectral range from 0.2 to 2.5 μm. The measurement configuration used is similar to Drant et al. (2024), except that we included an optical diaphragm placed directly prior to the sample, in the sample compartment, to reduce the size of the beam spot (≈ 3–5 mm). With this configuration, we probed a smaller area of the sample’s surface and thus prevented biases caused by small thickness variability while still maintaining a high signal-to-noise ratio. We performed two to three measurements at different positions on each sample to derive an uncertainty on the refractive indices attributed to small variations in the sample thickness (see Appendix A for more details on the thickness variability of our samples). Since the PAMPRE and COSmIC samples are produced via different mechanisms (chemical growth vs. particle stacking, respectively, see Section 2.2), their respective film thickness varies significantly (see Appendices A and B). An important thickness variability is observed across the surface of the COSmIC samples following the particle stacking mechanism, which is sensitive to spatial inhomogeneities of the plasma along the slit during the experiments (Sciamma-O’Brien et al. 2023). Given the millimeter-sized beam spot, it is difficult to probe a surface region with homogeneous thickness on the COSmIC samples. For that reason, another technique described in Sect 3.2 was used for the COSmIC samples, and only the PAMPRE analog samples were characterized with UV-visible-NIR transmission spectroscopy as they do not exhibit thickness variability at this scale. Fig. 2 shows the transmission spectra (blue curves) obtained on the Titan 1 and Exoplanet 2 analogs, both produced with the PAMPRE setup.
3.2 Reflection spectroscopy in the UV-visible-NIR
Spectroscopic measurements, in a reflection configuration, were carried out from 0.2 to 1.67 μm using the Filmetrics F40-UVX microscope spectrometer based at the NASA Ames Research Center. The measurements were performed at normal incidence using a 10 × reflective microscope objective. A very high spatial resolution, with a spot size around 25–50 μm, can be attained with this instrument. It allowed us to probe a region with homogeneous thickness on the COSmIC samples. These reflection measurements were also performed on a few PAMPRE analogs; however, we used the refractive indices derived from the transmission data (Sect. 3.1) since they cover a broader spectral range. For each COSmIC analog, three to five measurements were taken at different locations on the sample to derive an uncertainty on the retrieved refractive indices (see Appendix B for more details). In a previous study, Sciamma-O’Brien et al. (2023) successfully used this approach to determine the refractive indices of haze analogs. However, accurate and positive k values could not be retrieved for all the analogs in the NIR. In the present work, we improved the beam focalization of the measurements to constrain accurate k values in the NIR for each analog. Fig. 3 presents the reflection spectra (blue curves) obtained on the Titan 1 and Exoplanet 2 COSmIC haze analogs.
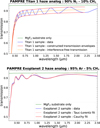 |
Fig. 2 Transmission spectra obtained on the Titan 1 and Exoplanet 2 PAMPRE haze analogs (see Table 1) from 0.3 to 2.5 μm. Top: data and analysis using the Swanepoel method for the Titan 1 sample produced from a gas mixture of 90% N2 and 10% CH4. Bottom: data and best fit using Cauchy and Tauc–Lorentz dispersion laws for the Exoplanet 2 analog produced from 95% Ar and 5% CH4 in the initial gas mixture. |
3.3 Reflection ellipsometry in the UV-visible
Drant et al. (2024) recently reported a reasonable agreement between the refractive indices of haze analogs derived using reflection ellipsometry and transmission spectroscopy in the UV-visible. Only a small discrepancy around 3–4% on the real part of the refractive index n was observed. To ensure the reliability of our refractive indices in the present work, reflection ellipsometric measurements were performed on several analogs (see Table 1) in a wavelength range limited to the UV-visible. Other transmission and reflection spectroscopic measurements described in the previous sections (Sects. 3.1 and 3.2) provided data at longer wavelengths in the NIR. The main purpose of these additional ellipsometric measurements was to ensure reasonable agreement between the refractive indices determined and thus assess the robustness of our results.
We used the Jobin–Yvon UV-Vis Ellipsometer (UVISEL) at the LPICM (Laboratoire de Physique des Interfaces et des Couches Minces) laboratory, in Palaiseau (France), to measure the reflecting properties of our samples, from 0.27 to 0.83 μm with two polarization states. The instrument and the operating configurations are described in Drant et al. (2024). The ellipsometric data are shown in Fig. 4 (blue points) for the Titan 1 COSmIC analog and Exoplanet 2 PAMPRE analog (see Table 1). For each analog, we performed measurements at three different positions on the sample to assess the thickness variability and derive an uncertainty on the determined refractive indices.
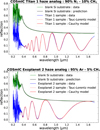 |
Fig. 3 Reflection spectra obtained on the Titan 1 and Exoplanet 2 COSmIC haze analogs (see Table 1) from ≈ 0.4 to 1.67 μm. The data are fit with both Tauc–Lorentz and Cauchy functions to determine the refractive indices. |
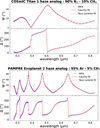 |
Fig. 4 Ellipsometric data obtained in reflection configuration for the Titan 1 COSmIC haze analog (top panel) and Exoplanet 2 PAMPRE haze analog (bottom panel). The data are fit to the theoretical model considering both Cauchy and Tauc–Lorentz parameterized functions for the dispersion of the refractive indices. |
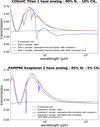 |
Fig. 5 Spectroscopic transmission spectra from 1.5 to 200 μm for the Titan 1 COSmIC haze analog (top) and the Exoplanet 2 PAMPRE haze analog (bottom). The simulated absorption-free transmission assuming a constant real refractive index, n, is shown (black curve). The film thickness is fit to match the observed interference fringes in the NIR. The simulated absorption-free transmission spectrum, now accounting for spectral variations in n in the IR (with SSKK model), is also shown (red curve). |
3.4 Transmission spectroscopy from near-IR to far-IR
Transmission measurements were performed from NIR to FIR (1.5–200 μm) using the Bruker IFS125HR Fourier-Transform IR (FTIR) spectrometer at the Ailes beamline of synchrotron SOLEIL. Two independent measurements were needed to cover the entire IR since the beamsplitter, and the detector had to be changed to ensure the accuracy of our data. For the NIR and MIR (1.5–15 μm), we used a KBr beamsplitter and a MCT detector cooled with liquid nitrogen. In the FIR (15–200 μm), a six-micron multilayer mylar beamsplitter and a 4.2 K bolometer detector (Irlabs) cooled with liquid helium were used. The aperture in the optical compartment, prior to the sample compartment, was set to 1 mm to ensure a small beam spot size on the haze analog sample and thus prevent biases caused by thickness variability. The transmission measurements were performed at normal incidence. During the measurement, the entire instrument was under vacuum, pumped down to ≈ 5.10−3 hPa, to optimize the stability of the source and avoid the presence of atmospheric gaseous signatures in the spectra. We acquired spectra at two different positions on each analog sample in the entire spectral range. For the MIR and FIR measurements, we used similar positions on the sample to avoid thickness variations and ensure reliable concatenation of the datasets at 15 μm. Fig. 5 shows the transmission spectra (more details on the spectra treatment in Section 4) obtained from 1.5 to 200 μm for the Titan 1 COSmIC analog and Exoplanet 2 PAMPRE analog.
In addition to these data acquired at room temperature, we performed NIR and MIR transmission measurements (1.5–12 μm) at low temperature using a similar FTIR instrument coupled to 4 K Two-Stage Pulse Tube Cryocoolers (Cryomech). The aim of these measurements was to assess the influence of the sample temperature on its refractive indices and more specifically on the relative strengths of IR vibrational modes. In contact with the sample holder, the cryostat system was used to cool the temperature of the sample down to 40 K and thus covered temperature conditions relevant for the surface and atmosphere of Titan and Pluto. With this setup, the instrument was pumped down to a higher vacuum, ≈ 6 × 10⁻⁶ hPa, to minimize the condensation of water on the sample that tends to add unwanted features in the spectra. These experiments are expensive in time as the temperature must be stabilized accurately at each temperature step. For that reason, these measurements were performed only on a few analogs (see Table 1), and we limited the number of temperature steps to seven. A transmission spectrum was taken at 40, 90, 110, 130, 150, 190, and 288 K. Fig. 6 presents the transmission spectra acquired from 1.5 to 12 μm at low temperature on the PAMPRE Titan 2 haze analog. The contribution of water condensation could not be completely prevented, despite the high vacuum, which explains the variations in the transmission between 2.7 and 3.2 μm caused by the wide O−H feature overlapping with the amine N−H bands of our haze analogs.
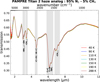 |
Fig. 6 NIR-MIR transmission spectra of the Titan 2 PAMPRE haze analog produced from a gas mixture of 95% N2 and 5% CH4 (Table 1). The different spectra were obtained at different temperatures using the cryostat setup (see Sect. 3.4). |
4 Determination of the haze analogs refractive indices from UV to far-IR
4.1 General description of the model and theory
The different spectroscopic and ellipsometric measurements used (Sect. 3) monitor the reflection and/or transmission properties of our haze analog samples. The theoretical expressions of transmission and reflection for our samples, consisting of a thin film overlaying a substrate, follow (Harbecke 1986; Stenzel et al. 1991; Imanaka et al. 2012):
 (1)
(1)
 (2)
(2)
 (3)
(3)
where a, f, and s refer to the different media, i.e., air, film, and substrate, respectively; T and R refer to the measured transmission and reflection, respectively, whereas t and r are their respective Fresnel coefficients; β is the optical phase, with βs, im referring to its imaginary part for the substrate; d is the thickness of the medium (film or substrate); and θi is the angle of incidence on the sample.
These expressions in Eqs. (1)–(3) make up the basis of our theoretical model used to fit the experimental data. The model parameters include the incident angle on the sample during the measurement (θi), the refractive indices of the substrate (ns – ks), the thickness of the substrate (ds), the refractive indices of the haze film analog (nf–kf), and the thickness of the haze film (df). Some of these parameters must a priori be known to simplify the data analysis and retrieve the refractive indices of the haze film. Only the thickness and/or refractive indices of the film were unknown and fit during the data analysis. The materials used as substrates were chosen specifically for their known n and k values in the different spectral ranges. More details on the data analysis associated with each measurement are provided in the following sections. We emphasize that the theoretical description used in the model (Eqs. (1)–(3)) is fully accurate only for an ideal sample structure and measurement where the film thickness is homogeneous and the light beam is collimated. In practice, the film thickness varies across the surface of the sample, and the light beam of the instrument is focalized. These properties of the samples and instrument must be carefully considered to avoid biases on the refractive indices determined. This motivated the use of different techniques and measurements described in Section 3 to identify the most reliable, i.e., the one providing conditions that most closely approximate this ideal theoretical description.
The typical approach to retrieving the refractive indices is to iteratively fit the data to the theoretical model (i.e., Eqs. (1)–(3)) within a given spectral range. We developed an in-house Python model based on nonlinear iterative least-square fitting (scipy packages) to retrieve the film thickness and refractive indices using both spectroscopic and ellipsometric data. The iterative numerical core is common for the different types of data. A first library contains the different theoretical descriptions to consider ellipsometry and spectroscopy. It includes the general equations of reflection and transmission in Eqs. (1)–(3) as well as simplifications discussed in the following sections. A second library compiles different parameterized functions, each with their own assumptions and limitations, used to describe the spectral dispersion of the refractive indices. The different coefficients in these functions are the parameters fit during the data analysis, in addition to the film thickness.
Among the large number of existing physical descriptions providing parameterized functions for the refractive indices, we used the Tauc–Lorentz equations to describe the spectral dispersion of n and k in the transition between electronic and atomic polarization at UV-visible wavelengths. The Tauc–Lorentz formalism expresses the imaginary part of the dielectric constant ε2 as the product of Tauc’s equation with the classical Lorentz oscillator (Tauc et al. 1966; Campi & Coriasso 1988):
 (4)
(4)
where E is the energy (eV), and Eg is Tauc’s bandgap energy (eV). A, Eo, and C are respectively the strength (eV), position (eV), and width (eV) of the Lorentz oscillator.
The real part of the dielectric constant ε1 can be expressed analytically from ε2 (Jellison & Modine 1996) following Kramers–Kronig causality (Kronig 1926; Kramers 1927). An additional ε∞ coefficient scales ε1 at infinite energy (or wavenumber). The values n and k were derived directly from the dielectric constant (ε=ε1+i ε2) following (Fujiwara 2007):
![Mathematical equation: $\begin{align*} & n=\left[\frac{1}{2}\left[\varepsilon_{1}+\left(\varepsilon_{1}^{2}+\varepsilon_{2}^{2}\right)^{1 / 2}\right]\right]^{1 / 2} \\ & k=\left[\frac{1}{2}\left[-\varepsilon_{1}+\left(\varepsilon_{1}^{2}+\varepsilon_{2}^{2}\right)^{1 / 2}\right]\right]^{1 / 2}\end{align*}$](/articles/aa/full_html/2026/02/aa55916-25/aa55916-25-eq5.png) (5)
(5)
Since k → 0 below the bandgap energy, by definition, in the Tauc–Lorentz description (Eq. (4)), the low k values of our weakly absorbing haze analogs in the visible-NIR could not be retrieved accurately (Gavilan et al. 2017; Jovanovic et al. 2021; Drant et al. 2024). Another approach relies on the use of monotonic power-law functions to quantify the spectral slope in the UV-visible caused by electronic transitions at higher energies. This so-called Cauchy formalism expresses n and k as (Jenkins & White 1981):
 (6)
(6)
where n∞ and k∞ are constants used to scale n and k, respectively. The values λn, 1, λn, 2, λk, 1, and λk, 2 are additional constants to describe the dispersion of n and k at shorter wavelengths. The units of these parameters ensure dimensionless n and k values.
The Cauchy and Tauc–Lorentz functions have both advantages and limitations. The Cauchy description enables the quantification of low k values essential to interpret observations in the visible-NIR (e.g., Sciamma-O’Brien et al. (2023)). The Tauc–Lorentz expression, however, ensures an accurate physical correlation between n and k since it satisfies Kramers–Kronig causality. Cauchy, on the other hand, expresses n and k with independent coefficients (Eq. (6)) and thus does not necessarily ensure the validity of the Kramers–Kronig correlation. The schematic in Fig. 7 describes the different features of our model including the different libraries and the numerical procedure to determine refractive indices from laboratory data in the UV-visible-IR spectral range.
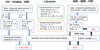 |
Fig. 7 Schematic summarizing different procedures to determine refractive indices from spectroscopic and ellipsometric data spanning UV to far-IR. The data include transmission (T), reflection (R), and the ellipsometric angles (Δ and Ψ). The values f and s refer to film and substrate, respectively; θi is the angle of incidence on the sample during the measurement; and d refers to the thickness of the film (df) and substrate (ds). SSKK refers to the singly subtractive Kramers–Kronig equation (Eq. (11)) describing the correlation between n and k values. |
4.2 Analysis of UV-visible-NIR transmission data
Previous work by Drant et al. (2024) revealed that the Swanepoel analytical method (Swanepoel 1983) or iterative least-square fitting of transmission data can provide accurate refractive indices on laboratory haze analogs. To ensure the reliability of the data analysis and apply the Swanepoel method, we used a MgF2 optical window to act as the substrate of the haze analogs. Since MgF2 is transparent from UV to NIR and its refractive index ns(≈ 1.38, Dodge 1984) is lower than the haze refractive index (expected ≈ 1.5–1.8), the theoretical expression of transmission in Eq. (1) simplifies to (Swanepoel 1983)
 (7)
(7)
where α is the absorption coefficient.
Swanepoel (1983) showed that n and k can be calculated analytically from the data in this configuration:
 (8)
(8)
where Tm and TM are transmission envelopes constructed using the data.
During the data analysis, the analog refractive indices and the film thickness were the only unknown parameters since the angle of incidence was set to 0° and the refractive indices of MgF2 were known (Dodge 1984) and compiled from the Refractive Index database1. Depending on the thickness of the haze film, two different procedures can be used to determine the refractive indices from the transmission data. For most analogs, we used the Swanepoel method based on analytical calculations. This approach is reliable as long as a large number of interference fringes are observed on the spectrum. The different fringe extrema are used to construct the transmission envelopes (see Fig. 2, top panel). The accuracy of the calculations strongly relies on the construction of these envelopes. A low film thickness will be characterized by a spectrum with fewer fringes, which does not provide enough information to accurately constrain Tm and TM. We generally found that a film thickness above ≈ 1 μm is sufficient to construct reliable transmission envelopes. Fig. 2 (top panel) shows the analysis of the transmission data with the Swanepoel method for the Titan 1 PAMPRE haze analog. A film thickness below 1 μm was only seen on the Exoplanet 2 PAMPRE analog, leading to larger error bars on the retrieved refractive indices with the Swanepoel method (see Appendix A for the analyses of all the PAMPRE analogs). For that reason, we used a different approach where the transmission data are fit directly to the theoretical model, i.e., Eq. (7), in order to retrieve the refractive indices with the iterative approach described in Sect. 4.1. The transmission spectrum of the Exoplanet 2 PAMPRE analog was fit with the Tauc–Lorentz and Cauchy dispersion functions in Fig. 2 (bottom panel). The two procedures used to analyze the transmission spectra and retrieve n and k, i.e., Swanepoel method and iterative fitting, are summarized in Fig. 7. The results are discussed in Section 5.
4.3 Analysis of UV-visible-NIR reflection data
For the reflection measurements, we used the sample where the film is deposited on a doped silicon wafer. Si was chosen for its highly absorbing properties in the UV-visible (Aspnes & Studna 1983) preventing incoherent multiple reflection within the substrate. In addition, the back face of the Si wafer is rough, thus inducing scattering and preventing multiple reflection even above 1 μm, when Si becomes transparent. By eliminating the multiple reflection within the substrate, we reduced the parameter space of the model since the substrate thickness was no longer required, and the general expression of reflection in Eq. (2) simplified to
 (9)
(9)
The data analysis was performed with the iterative approach described in Sect. 4.1 using Eq. (9) as the theoretical expression of reflection. The thickness and refractive indices of the film analog were the only unknowns. The refractive indices of silicon were needed to consider reflection at the interface between the film and substrate. These refractive indices are well known (Aspnes & Studna 1983) and were used as input parameters during the data analysis. The data are fit to the theoretical model with the Cauchy and Tauc–Lorentz expressions of n and k in Fig. 3. The iterative procedure used on reflection data to determine n and k values is summarized in Fig. 7. We limited the fit to the spectral range with visible interference fringes and high signal-to-noise ratio. The short-end of the wavelength range depends on the film thickness and the absorbing properties of the sample, thus varying depending on the analog. Since the COSmIC samples exhibit high absorption properties, the fit is often unreliable in the UV, thus limiting the retrieval of refractive indices to the visible-NIR. The short-end wavelength limit taken for the analysis of each sample is indicated in Table 1. The analyses of all the COSmIC samples’ reflection data are provided in Appendix B along with the film thicknesses determined. The results are discussed in Section 5.
4.4 Analysis of UV-visible ellipsometric data
Standard ellipsometry relies on the measurement of reflection using two polarization states to retrieve the ellipsometric angles Δ and Ψ describing the phase shift and amplitude ratio, respectively. The ratio of parallel (p) and perpendicular (s) reflectance can be expressed using these ellipsometric angles:
 (10)
(10)
Eqs. (9) and (10) were added to the library of our model for theoretical expressions (see Fig. 7).
For the ellipsometric measurements, we also used the sample with the film deposited on a doped silicon wafer to prevent incoherent multiple reflection within the substrate. For the data analysis, only the refractive indices and thickness of the haze film layer were unknown following Eqs. (9) and (10). A first measurement performed on the blank Si substrate constrained the angle of incidence precisely to 69.9°. The ellipsometric data are fit to the theoretical model using both Cauchy and Tauc–Lorentz functions in Fig. 4. The results are discussed in Section 5.1.
4.5 Analysis of NIR-FIR transmission data
For the IR transmission measurements, we used the analog sample with the film deposited onto the intrinsic Si substrate with both sides polished. Si was chosen for its transparency in the entire IR spectral range, allowing us to constrain the absorbing properties of the film alone without significant contribution from the substrate. As stated in Drant et al. (2024), FTIR measurements did not directly provide absolute data, as the measured intensity is very sensitive to variations in the source intensity over time. Several corrections had to be performed on the data to obtain an absolute transmission and retrieve reliable n and k values. First, the measured intensity spectra of the blank substrate and samples were divided by an open-beam reference intensity spectrum to obtain an “uncorrected” transmission. A reference spectrum was acquired regularly (every three hours approximately) to account for variations in the source intensity and detection efficiency over time. At this stage, the transmission was not yet absolute and was said to be “uncorrected.” The different procedures to treat the transmission data are detailed in the following.
First, interference fringes caused by multiple reflection within the substrate were removed from the spectra following the procedure with transmission envelopes described in Swanepoel (1983). Given the 300−μm thick substrate, the spectral frequency of the fringes caused by the substrate is significantly higher than those caused by the film, making them easily distinguishable. The transmission data shown in Figs. 5 and 6 were treated to remove the fringes caused by the substrate, and only the fringes caused by the film remain.
Since the theoretical transmission of a silicon wafer can be easily calculated using its known refractive indices (Salzberg & Villa 1957; Edwards & Ochoa 1980), a first comparison between the measured and theoretical transmission of silicon tells us if additional corrections are needed to obtain absolute data. We used the ratio between the measured and theoretical transmission of Si as a first correction factor, which we applied to our data to correct any vertical shift caused by variations in the lamp intensity and/or detection efficiency between the measurements. This correction also removed the small absorption features observed in the spectrum of Si, which are attributed to silicon oxides and caused by a small oxidation layer at the surface of the substrate. In theory, this first correction on the data should suffice if there are no variations in the source intensity between the measurement of the blank Si substrate and the haze analog sample. In practice, this assumption is not always valid, and another correction is required to further improve the data.
For this second and last correction, we first fit the haze analog film thickness using the fringes observed on the transmission data from 1.5 to 2.5 μm (see Fig. 5). Only the film thickness was fit using the refractive indices previously derived with the UV-visible-NIR measurements (see Sects. 4.2 and 4.3). Once the film thickness was determined, we simulated the absolute transmission of our haze analog sample in the NIR and compared it to the measured data. If variations in the source intensity occurred between the measurement of the blank substrate and analog sample, a vertical shift is observed between the simulated and measured transmission spectra of the haze analog sample. If not corrected, this shift leads to strong biases in the retrieved k values. The ratio of the measured and simulated NIR transmission provides the last correction factor to obtain an actual absolute transmission unaffected by measurement biases.
For the data analysis, the procedure consists of fitting the absolute IR transmission of the haze analog sample with the theoretical expression in Eq. (1). For the fit, one could describe spectral variations in n and k using a set of Lorentz oscillators following the procedure in Drant et al. (2024) used to analyze MIR Mueller ellipsometric data. In practice, too many model parameters must be fit depending on the number of absorption features, and strong model degeneracy can bias the results (Drant et al. 2024). We therefore used a different approach in which only k is retrieved from the fit and n is calculated using a singly subtractive Kramers–Kronig (SSKK) model to ensure an accurate physical correlation between both real and imaginary parts of the refractive index.
The model used for the IR resembles the approach of Imanaka et al. (2012). At the first iteration, k was the only unknown fit at each data point (at each wavelength) since n was assumed constant in the entire IR following the value derived at 1.6 μm with the UV-visible-NIR measurements (see Sects. 4.2 and 4.3). The film thickness was already derived using interference fringes in the NIR. A first spectrum of k was obtained using iterative least-square fitting between the absolute transmission spectrum and the model (Eq. (1)). Fig. 5 shows the first simulated absorption-free (k=0) transmission spectrum for the Titan 1 COSmIC analog and the Exoplanet 2 PAMPRE analog (black curves). This simulation does not consider absorption by the film but considers its thickness and the resulting interference fringes. The difference between the data (in blue) and this first absorption-free simulation (black) constrains k.
Using the retrieved k values and an anchor refractive index n at a specific wavelength, the n spectrum was derived from the SSKK equation following (Hawranek et al. 1976):
![Mathematical equation: $n\left(v_{i}\right)=n_{r}+\frac{2}{\pi}\left[P \int_{0}^{\infty} \frac{v k(v)}{v^{2}-v_{i}^{2}} d v-P \int_{0}^{\infty} \frac{v k(v)}{v^{2}-v_{r}^{2}} d v\right]$](/articles/aa/full_html/2026/02/aa55916-25/aa55916-25-eq11.png) (11)
(11)
where nr and vr are the anchor point real refractive index and wavenumber (cm−1), respectively. P is the Cauchy principal value of the integral.
Our model was constructed following Maclaurin’s formula, which Ohta & Ishida (1988) previously identified as the most reliable numerical approach for performing the integral in Eq. (11). For nr, we used the n value derived at 1.6 μm with our UV-visible-NIR measurements. Once n was calculated in the IR, we repeated the first procedure to derive a new k spectrum, now taking into account the spectral variations in n in the IR. We repeated this procedure until the difference in n and k between two iterations was below 1%. In practice, less than six iterations are sufficient as the main variations occur during the first iteration. This iterative procedure used to derive the refractive indices from IR transmission data is summarized in Fig. 7. Fig. 5 shows the simulated absorption-free (k=0) transmission spectrum after the first SSKK iteration for the Titan 1 COSmIC analog and Exoplanet 2 PAMPRE analog (red curves). The difference between the first simulation (in black) assuming a constant n in the IR and the simulation with SSKK (in red) reflects the effect that spectral variations in n have on the spectra and the bias it can cause on the retrieved k values. For the Exoplanet 2 PAMPRE analog, the SSKK correction has little impact on the transmission spectrum and the data analysis since the C−H features are not strong enough to cause significant variations in n (Fig. 5, bottom panel). On the other hand, the SSKK correction has a significant effect on the transmission spectrum and data analysis for the Titan 1 COSmIC analog (Fig. 5, top panel). This stems from the strong (hetero-)aromatic C=C and C=N features causing important variations in n around 6 μm. Generally, the data analysis of the haze analogs produced from an Ar-dominated mixture (Exoplanet 2 and 3 samples in Table 1) is rather insensitive to spectral variations in n, contrary to the analysis of the other samples produced from a N2-dominated gas mixture (see Table 1). The use of an iterative model satisfying Kramers–Kronig correlation between n and k is thus essential to retrieve accurate refractive indices in the entire IR range. Appendix C presents the analysis of the IR data for all the COSmIC and PAMPRE haze analogs. The results are discussed in Section 5.
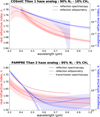 |
Fig. 8 Influence of the measurement technique used on the retrieved refractive indices n and k in the UV-visible and near-IR. Top: comparison between the refractive indices determined by reflection ellipsometry and reflection spectroscopy for the COSmIC Titan 1 analog. Bottom: comparison between the refractive indices determined by reflection ellipsometry, reflection spectroscopy, and transmission spectroscopy for the PAMPRE Titan 2 analog. |
5 Results and discussions
5.1 Identifying the best technique to retrieve refractive indices from UV to near-IR
The previous studies of Khare et al. (1984) and Tran et al. (2003) revealed discrepancies in the derived real refractive index between different optical techniques. A discrepancy around 3% between transmission spectroscopy and reflection ellipsometry was reported more recently by Drant et al. (2024). In the present work, we performed a similar comparison to Drant et al. (2024) and found that the discrepancy in n is caused by the difficulty in retrieving accurate k values from our reflection measurements in the visible-NIR spectral range. Fig. 8 (top panel) compares the UV-visible refractive indices derived from reflection spectroscopy and reflection ellipsometry on the COSmIC Titan 1 haze analog produced from a gas mixture of 90% N2 and 10% CH4. We find a good agreement between both datasets within the range of uncertainty. The bottom panel of Fig. 8 compares the UV-visible-NIR refractive indices derived from transmission spectroscopy, reflection spectroscopy, and reflection ellipsometry on the PAMPRE Titan 2 haze analog produced with 95% N2 and 5% CH4. We generally found that transmission spectroscopy and reflection spectroscopy provide similar refractive indices within the error bars, although reflection spectroscopy is, in the case of our measurements and samples, more affected by biases and requires careful beam focalization. The absorption slope below 0.5 μm obtained from ellipsometric data is well constrained and in agreement with the transmission data, but the k values retrieved from ellipsometry are unconstrained in the region of weak absorption, above 0.5 μm, regardless of the functional forms of n and k (i.e., Cauchy or Tauc–Lorentz) used during the data analysis. Our reflection ellipsometric measurements are not sensitive enough to constrain these low k values on the PAMPRE analogs, in the visible spectral range. This lack of sensitivity also influences the fitted n values. In Fig. 8 (bottom), the n values obtained with reflection ellipsometry are higher than those determined with transmission spectroscopy and reflection spectroscopy. This difference is explained by the lack of constraints on k in the ellipsometric data, above 0.5 μm, which likely also caused the discrepancy reported by Drant et al. (2024). The discrepancy in n between spectroscopy and ellipsometry is not observed for the COSmIC analogs since their highly absorbing properties in the entire UV-visible range allow us to retrieve k accurately. We generally found that k is not well constrained with reflection ellipsometry for values below 5.10−3. We emphasize that these limitations depend on the instruments used and on the structure of the samples.
Unlike reflection, which is mostly sensitive to variations in the real refractive index n between the film and substrate, transmission is more sensitive to absorption. In contrast, k is constrained more efficiently as it directly correlates to the difference between the transmission of the substrate and the transmission envelopes of the analog (difference between red and green curves in the top panel of Fig. 2). The choice of description to express the spectral variations in n and k, i.e., Tauc–Lorentz or Cauchy, with the iterative model (Sect. 4.1), however, significantly influences the fit (see Fig. 2, bottom panel) and the retrieved n values. The measured transmission is sensitive to very weak absorption. The assumption of k=0 below the bandgap energy in the Tauc–Lorentz description leads to an artificial increase in the interference fringes’ amplitude during the fitting procedure (see Fig. 2, bottom panel). To reproduce the fringes observed in the data while assuming k=0, the model increases n values. In other words, the assumption of k=0 below the bandgap energy in the Tauc–Lorentz model is not appropriate for transmission data, even in the NIR, as it leads to overestimations of n to improve the goodness of fit. Given the strong correlation between real refractive index and film thickness in the law of interference (phase parameter, Eq. (3)), the overestimation of n also leads to an underestimation of the film thickness to maintain the product n × d constant. This sensitivity analysis suggests that the use of the Cauchy expressions for n and k is generally more reliable for our weakly absorbing samples in the visible-NIR spectral range.
In summary, the lack of sensitivity to low k values in our ellipsometric data or the use of simplified models assuming k= 0, such as Tauc–Lorentz, lead to similar biases on the refractive indices determined. Both n and k indeed influence the amplitude of interference fringes seen in the data. If an incorrect assumption is made on one of these two parameters, for example, k= 0, or if one of these parameters is not constrained by the data, the other parameter will not be fit accurately. We suggest the use of transmission and reflection data analyzed with iterative fitting (with Cauchy expressions of n and k) or Swanepoel calculations to obtain more reliable n and k values in the visible-NIR.
5.2 Refractive indices of Titan haze analogs
Fig. 9 shows the refractive indices retrieved from UV to FIR for the different Titan haze analogs produced with the COSmIC and PAMPRE setups. We only show the refractive indices determined using the Cauchy expressions of n and k in the iterative model, in the UV-visible-NIR spectral range (see Sects. 4.2 and 4.3), since they provide more reliable estimates (see Sect. 5.1). For the NIR k values, higher uncertainties are reported for the COSmIC analogs compared to the PAMPRE analogs. It stems from the reflection measurements used, which were found to be very sensitive to beam focalization. In addition, an important thickness variability is observed on the COSmIC samples (see more details in Appendix B).
Fig. 9 reveals that the refractive indices of the Titan haze analogs are strongly affected by both the gas composition (gas relative abundance N2/CH4) and the experimental setup used for their production. Since previous studies have performed elemental analyses on similar COSmIC and PAMPRE Titan analogs and reported their N/C ratio (Carrasco et al. 2016; Nuevo et al. 2022), we can use these previous data and emphasize the correlation between the N/C ratio of the solid analogs and their refractive indices in a broad spectral range. Nuevo et al. (2022) reported N/C=1.1 ± 0.37 for their COSmIC Titan analog produced from a gas mixture of 90% N2 and 10% CH4 (Titan 1, Table 1), and N/C=0.77 ± 0.12 for their analog produced from a gas mixture of 95% N2 and 5% CH4 (Titan 2, Table 1). It therefore seems that the bulk N/C ratio in the solid COSmIC Titan analogs decreases with increasing N2/CH4 in the initial gas mixture. In contrast, an opposite trend was reported for the PAMPRE Titan analogs. Carrasco et al. (2016) observed an increase in the N/C ratio of their Titan 1 and Titan 2 haze analogs correlated with the increase in the N2/CH4 ratio chosen for the initial gas mixture. They reported N/C=0.1 and 0.2 for their Titan 1 and Titan 2 analogs, respectively.
Fig. 9 (middle panel) indicates that the UV-visible imaginary refractive index of the COSmIC and PAMPRE Titan analogs changes with the relative abundance of N2/CH4 in the initial gas mixture. A similar trend is observed for the PAMPRE and COSmIC Titan analogs where k increases with increasing N2/CH4 ratio in the initial gas mixture and the bandgap energy (Eg, Eq. (4)) shifts toward lower energies (longer wavelengths) when the initial gas composition is richer in nitrogen. A similar behavior was observed by Mahjoub et al. (2012) on their PAMPRE Titan analogs. Based on the known N/C ratio for the PAMPRE Titan analogs, the refractive indices data suggest an increase in k in the UV-visible and a shift of the bandgap energy toward lower energies when the solid haze material is richer in nitrogen. Since the nN → 3 sa and nN → 3 pa electronic transitions (5.7–8 eV) associated with amine functional groups peak at lower energies than the σ-σ* and n-σ* transitions (10–12 eV) associated with methyl groups (e.g., Gavilan et al. (2018) and references therein), a material richer in amine groups, and more generally richer in nitrogen, should indeed exhibit higher k values and a shift of Eg toward longer wavelengths as seen for our analogs (Fig. 9, middle panel). In other words, the incorporation of nitrogen and formation of amine structures in the solid material lead to stronger absorbing properties in the UV-visible range in response to electronic transitions peaking at shorter wavelengths, not covered by our measurements. The trend between k and the gas N2/CH4 ratio is similar for the COSmIC Titan analogs. This means that the correlation between UV-visible k values and the N/C ratio in the solid is different compared to the interpretation made for the PAMPRE Titan analogs. We note, however, that the bulk elemental analyses of Nuevo et al. (2022) were made on COSmIC analogs produced with a voltage of −800 V for the plasma discharge, whereas the analogs used for the present study were made with a voltage of −700 V. Since previous work has shown that changes in the plasma voltage between −1000 V and −700 V in the COSmIC setup can significantly influence the UV-visible k values and thus the haze analog composition (Sciamma-O’Brien et al. 2023), it is possible that the N/C ratios of our COSmIC Titan analogs are different than those reported by Nuevo et al. (2022). In addition, the N/C ratios determined by Nuevo et al. (2022) on both COSmIC Titan haze analogs could in fact be similar within the range of uncertainty. Additional elemental analysis measurements on our COSmIC Titan analogs are needed to better understand the correlation between refractive indices and compositional N/C ratio.
The real part of the refractive index n is similar in the NIR, around 1.58, for the two PAMPRE Titan analogs (Fig. 9, top panel) in agreement with previous ellipsometric measurements by Mahjoub et al. (2012) and Sciamma-O’Brien et al. (2012). For the COSmIC Titan haze analogs, n increases in the NIR for a higher initial N2/CH4 ratio in the gas phase (Fig. 9, top panel). It would suggest that the n values decrease following a higher N/C ratio in the solid analog. This result is in agreement with the data of Mahjoub et al. (2012) on PAMPRE Titan analogs although this behavior was only observed when the N2/CH4 ratio of the initial gas mixture is above 49, which corresponds to a gas mixture with an abundance of N2 equal to or above 98%.
In the MIR, Fig. 9 (middle and bottom panels) shows that the k values of the PAMPRE Titan analogs, reflecting bending and stretching resonances, also vary with the N2/CH4 ratio in the initial gas mixture. The amine −NH1, 2 features (3.1–3.3 μm) are stronger for the PAMPRE Titan 2 analog compared to the PAMPRE Titan 1 analog in agreement with previous IR analyses by Mahjoub et al. (2012) and Gautier et al. (2012). These higher k values, attributed to amine modes, for the PAMPRE Titan 2 analog correlate with a higher N/C ratio in the solid. The strength of –CH2, 3 aliphatic and/or alkane stretching features (3.37–3.5 μm) is similar for both PAMPRE Titan analogs (Fig. 9, middle and bottom panel). Carrasco et al. (2016) indeed reported a similar H/C ratio, around 0.1, for the Titan analogs produced using different N2/CH4 ratio in the gas phase. The k values associated with alkene, aromatic, hetero-aromatic, and −NH2 features (6–6.6 μm) are also higher for the PAMPRE Titan 2 analog (Fig. 9, middle and bottom panels), which, following the higher N/C ratio in the solid, points to stronger C=N and –NH2 modes. For the COSmIC Titan analogs, on the other hand, the MIR k values are very similar for the two N2/CH4 conditions (see the middle and bottom panels of Fig. 9). This likely indicates that the composition of the COSmIC Titan analogs is not as sensitive to small variations in the gas composition as are the PAMPRE Titan analogs. The N/C ratio in the solid material indeed varies by a factor of 2 between the two PAMPRE Titan analogs (Carrasco et al. 2016), whereas it only varies by a factor of ≈ 0.5 between the two COSmIC Titan analogs (Nuevo et al. 2022).
At 4.88 μm, between nitrile (4.4–4.7 μm) and alkene, (hetero-)aromatic, or NH2(6–6.6 μm) features, a strong MIR resonance is observed on the COSmIC Titan analogs but not on the PAMPRE Titan analogs. The nature of this feature, previously observed in Sciamma-O’Brien et al. (2017), is unclear. It is likely caused by C=C=N or C=N=N (Carlson et al. 2016), or by adsorbed gaseous HCN trapped in the pores of the sample. Further investigations are required to understand the nature of this resonance. We also note that the Titan analog produced with 90% N2−10% CH4 (Titan 1 analog, Table 1) with the COSmIC setup presents a UV-visible k slope and NIR n values very similar to the analog of Khare et al. (1984) produced using a similar gas composition (Fig. 9, top and middle panels). The MIR k values attributed to alkene, aromatic, and hetero-aromatic C=C and C=N and −NH2(6–6.6 μm) features are also very similar between the COSmIC Titan 1 analog and the analog of Khare et al. (1984). This could suggest a similar solid composition between these analogs. A variation in the k values between these analogs is, however, observed around 3.1–3.3 μm (Fig. 9, middle and bottom panels). It could be explained by stronger amine −NH1, 2 features for the analogs of Khare et al. (1984) or by a stronger contribution of O−H in the Khare analogs. This latter hypothesis is possible since the gas bottles used by Khare et al. (1984) to produce their haze analogs were not as pure as those used in the present study. They thus contained water vapor at higher abundances, which could have influenced the gas chemistry and the composition of the solid analogs.
If we now compare the PAMPRE and COSmIC Titan haze analogs, Fig. 9 reveals significant differences in both n and k. These values are generally higher for the COSmIC analogs in the entire spectral range. The higher k values and lower bandgap energy of the COSmIC Titan analogs are explained, following our previous interpretation, by the higher N/C ratio in the COSmIC solid material (Carrasco et al. 2016; Nuevo et al. 2022). There is, in fact, a change in N/C ratio by a factor of 10 between the PAMPRE and COSmIC Titan 1 haze analogs, which likely explains the strong variations in k values in the UV-visible-NIR. It also explains the higher k values for the COSmIC Titan analogs at amine NH1, 2(3.1–3.3 μm), nitriles and/or iso-nitriles −C ≡ N /−N ≡ C (4.4–4.7 μm) and (hetero-)aromatic and/or alkene (6–6.6 μm) wavelengths compared to the PAMPRE Titan analogs. These differences between the refractive indices of the PAMPRE and COSmIC Titan analogs could be explained by the changes in gas residence time, gas temperature, and pressure between both setups (see Table 2). Imanaka et al. (2004) previously reported that the gas pressure from which hazes form strongly influences the bandgap energy and the UV-visible k values. The shorter gas residence time in the COSmIC setup compared to the PAMPRE setup (see Table 2) results in a simpler gas-phase chemistry, preventing the formation of complex carbon chains (Sciamma-O’Brien et al. 2014), which likely contributes to the higher N/C ratio observed in the COSmIC analogs compared to the PAMPRE analogs. Previous work also taught us that the change in nitrogen incorporation into the solid is sensitive to the gas temperature (He et al. 2022b) and the properties of the plasma source (Sciamma-O’Brien et al. 2023), which both change between the PAMPRE and COSmIC setups. Although the main experimental parameter influencing the change in refractive indices between the COSmIC and PAMPRE Titan analogs cannot be identified, a clear correlation with the N/C ratio of the analog is observed. Fig. 10 illustrates the correlation between the N/C ratio of the solid analog and the imaginary refractive index k at different wavelengths. The general trend suggests an increase in k in the visible and in the IR following the enhanced nitrogen incorporation in the solid. We emphasize, however, that additional measurements and further comparisons with other analogs are needed to better understand this correlation.
Previous analyses of Cassini-Huygens observations suggest that Titan hazes are highly absorbing in the UV-visible-NIR (Rannou et al. 2010, 2022; Sciamma-O’Brien et al. 2023) with k values higher than the data reported in the present work. It was suggested that this difference stems from a higher incorporation of nitrogen in Titan hazes compared to laboratory analogs (Sciamma-O’Brien et al. 2023). On the other hand, MIR observations of Titan hazes do not confirm the presence of nitrogenous modes and rather point to carbon-rich materials (Bellucci et al. 2009; Rannou et al. 2010; Kim et al. 2011; Vinatier et al. 2012; Kim & Courtin 2013; Courtin et al. 2015; Kim et al. 2018). Additional observations are needed to understand the absorbing properties of Titan hazes in a broad spectral range and how it correlates to the composition of the solid.
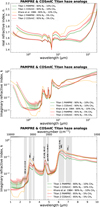 |
Fig. 9 Refractive indices n (top) and k (middle & bottom) of PAMPRE and COSmIC Titan haze analogs from UV to far-IR. Both the Titan 1 and Titan 2 analogs produced from different gas relative abundances N2/CH4 (see Table 1) are shown. The refractive indices of Khare et al. (1984) obtained for a Titan analog with an initial gas composition similar to our Titan 1 analog are also plotted for comparison. The attribution of IR resonances is shown on the bottom panel. |
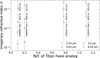 |
Fig. 10 Correlation between the N/C ratio of the solid haze analog and the imaginary refractive index k. The trend is shown at different wavelengths relevant to nitrogen absorption (visible wavelengths, N–H at 3 μm and C=N at 6.45 μm). |
5.3 Refractive indices of Pluto haze analogs
Fig. 11 shows the refractive indices n and k from UV to FIR of the Pluto haze analogs, produced from a gas mixture with 95% N2–4.95% CH4–0.05% CO using the PAMPRE and COSmIC setups. The refractive indices of the Titan 2 haze analogs, produced from a similar gas relative abundance N2/CH4, are shown in comparison to assess the influence of CO on the refractive indices of the analogs. We report a very strong agreement between the UV-visible refractive indices determined in the present study and those previously reported in Jovanovic et al. (2021) for the PAMPRE Pluto analog. The comparison of the Titan 2 and Pluto k values in Fig. 11 clearly indicate that the addition of 500 ppm of CO in the initial gas mixture does not significantly affect the refractive indices of the solid analog in the entire spectral range. The UV-visible k slope and the bandgap energy of the Pluto analog are similar to those of the Titan 2 analog produced with a similar setup (PAMPRE or COSmIC). Since electronic transitions associated with hydroxyl and carbonyl functional groups (between 3.5 and 5.8 eV) would likely create features at lower energies than the amine and methyl groups (Gavilan et al. (2018) and references therein), they should affect the UV-visible k values if present abundantly in the solid material. The similar k values of the Titan 2 and Pluto analogs suggest that these functional groups are not sufficiently abundant in the material, when adding 500 ppm of CO in the initial gas mixture, to influence the refractive indices. These results indicate that the differences of n and k observed by Jovanovic et al. (2021) in the UV-visible and NIR on different PAMPRE Pluto haze analogs are caused by the variations in the N2/CH4 ratio in the initial gas mixture and not by changes in the CH4/CO ratio.
The MIR k values of the Pluto analogs are also similar to their respective Titan 2 analogs produced with the same setup. The 6-μmC=O band previously observed in Jovanovic et al. (2020) on a different type of haze analog (not film but grains) is not clearly resolved here and does not affect the k values. The relative strength of –NH1, 2 amine (3.1–3.3 μm) and −CH2, 3 alkane and/or aliphatic (3.4–3.7 μm) MIR modes does not vary between the Titan 2 and Pluto analogs. Although CO does not seem to influence the refractive indices of our haze analogs, it was found to influence the gas-phase chemistry (Moran et al. 2022), the incorporation of oxygen into the solid (Jovanovic et al. 2020) and the size of haze analog particles (Hörst & Tolbert 2014).
In the FIR, the reported k values of our new Pluto analogs are different than previous predictions by Khare et al. (1984) for their Titan analog (see Fig. 9). These new data should be used to reassess the thermal cooling properties of Pluto’s atmospheric hazes previously discussed in Zhang et al. (2017), Wan et al. (2021) and Wan et al. (2023). The large differences in UV-visible k values between the PAMPRE and COSmIC Pluto haze analogs, which are likely caused by variations in N/C ratio in the solid (Sect. 5.2), may also explain the strong heterogeneity of Pluto’s surface colors (e.g., Grundy et al. 2018 and Lauer et al. 2021) if the composition of the organic material varies across Pluto’s surface.
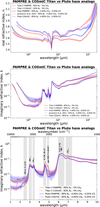 |
Fig. 11 Refractive indices n (top) and k (middle & bottom) of PAMPRE and COSmIC Pluto haze analogs from UV to far-IR (up to 200 μm). The n and k values of the Titan 2 haze analogs produced from a similar gas relative abundance N2/CH4 (see Table 1) are shown for comparison. |
5.4 Refractive indices of exoplanet haze analogs produced in CO-rich gas mixtures
Fig. 12 presents the refractive indices from UV to FIR of the Exoplanet 1 haze analog produced from a gas mixture of 95% N2−4% CH4−1% CO with the PAMPRE and COSmIC setups. The Pluto analog produced from a gas mixture with a higher CH4/CO abundance ratio is plotted in comparison, to evaluate the influence of CO on the refractive indices of the solid analogs. In addition, we show the refractive indices obtained by Drant et al. (2024), with PAMPRE, for a haze analog produced from a mixture of 95% N2–4% CH4–1% CO2, to compare the effect of CO and CO2 on the haze analogs’ refractive indices.
Fig. 12 (middle panel) reveals that the UV-visible k values of the PAMPRE analogs are poorly affected by the presence of 1% CO2 or CO in the gas mixture. This result suggests, once again, that the electronic transitions associated with hydroxyl and carbonyl functional groups are not strong compared to the strength of electronic transitions attributed to amine groups in the PAMPRE analogs. Lower CH4/CO gas abundance ratio may increase the oxygen content incorporated in the haze material and the number of hydroxyl and carbonyl groups, which could lead to higher k values in the UV-visible for the PAMPRE analogs. Additional experiments are required to verify this hypothesis. The comparison between the UV-visible k values of the COSmIC Pluto and Exoplanet 1 analogs highlights a slight variation in the slope in the visible likely caused by the change in the gas relative abundance CH4/CO. For the PAMPRE analogs, the decrease in the CH4/CO gas abundance ratio does not seem to influence the n values of the haze analogs (Fig. 12, top panel). For the COSmIC analogs, however, n seems to vary with the gas abundance ratio CH4/CO.
The MIR and FIR k values of the PAMPRE Exoplanet 1 and Pluto analogs produced from different gas relative abundances CH4/CO are also similar (Fig. 12, middle & bottom panels). The relative amine NH1, 2 and alkane or aliphatic CH2, 3 resonances are similar between both PAMPRE analogs and are also similar to those of the PAMPRE Titan 2 analog, which suggests a poor influence of CO on the N/C ratio in the haze material. This last result brings forth a significant difference between the influence of CO and CO2 on the haze refractive indices. The MIR k values obtained on the haze analog of Drant et al. (2024), produced from a gas mixture with 1% CO2 in the PAMPRE setup, revealed a strong increase in amine N-H signatures (3.1–3.3 μm) relative to alkane/aliphatic C−H modes (3.4–3.7 μm) and higher k values for the aromatic, hetero-aromatic, and alkene signatures around 6–6.6 μm (Fig. 12, middle and bottom panels). It is also likely that the increased k values for the analog of Drant et al. (2024) at 3 μm are partly due to O−H in addition to N−H. At 6 μm, the analog of Drant et al. (2024) produced from a CO2-rich mixture also exhibits a shift of the k slope toward shorter wavelengths, which suggests the contribution of C=O at 5.9 μm in addition to the C=C and C=N features at longer wavelengths (6–6.6 μm). This C=O contribution is, however, not clearly observed for the Exoplanet 1 analog, which could suggest that the haze analogs produced in CO2-rich mixtures incorporate larger amounts of oxygen compared to haze analogs produced in CO-rich mixtures. The photolysis of CO and CO2 is expected to produce oxygen radicals able to oxidize reduced hydrocarbons and thus inhibit the formation of complex hydrocarbon chains in the gas phase. Since CO2 is photolyzed more efficiently than CO, this oxidation mechanism should be more efficient in CO2-rich gas mixtures. The increased oxidizing power of CO2 likely leads to an increase in the N/C ratio in the solid analog by preventing the formation of complex hydrocarbons in the gas phase. Trainer et al. (2004a) indeed revealed that haze analogs formed in CO2-rich gas mixtures are made of simpler hydrocarbons compared to haze analogs produced without CO2. Additional investigations should be performed in the future to assess the composition of the haze material (i.e., N/C ratio and O/C ratio) and the nature of the gaseous photochemical products in CO-rich and CO2-rich conditions.
These new results clearly show that the correlation between the initial gas-phase composition and the haze refractive indices is not primarily sensitive to the gas C/O ratio but rather sensitive to the photodissociation efficiency of the oxygenated compound (e.g., CO or CO2) and its reactivity with hydrocarbon species. Since similar abundances of CO and CO2 can lead to different strengths in the IR haze signatures, the strategy proposed by Corrales et al. (2023) to constrain the atmospheric C/O using the haze IR absorbing properties could be biased depending on which oxygenated molecule is present in the atmosphere. Previous observations of exoplanet atmospheres, as well as modeling studies, revealed that the detection of CO in transit spectra is challenging given its weak IR opacity and its main absorption feature at 4.7 μm, which partly overlaps with that of CO2 (Wogan et al. 2024; Shorttle et al. 2024; Drant et al. 2025). The distinction between CO and CO2 contributions was, in fact, recently proven to be challenging for rocky exoplanets given the large error bars on the observational data (Hu et al. 2024). The difference in the IR absorbing properties between the hazes produced in CO-rich and CO2-rich gas mixtures could help constrain which molecule contributes to the absorption peak at 4.7 μm by using the amine, aromatic, alkene, and heteroaromatic haze signatures at other wavelengths (3–3.3 and 6−6.5 μm; see the bottom panel in Fig. 12).
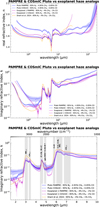 |
Fig. 12 Refractive indices n (top) and k (middle & bottom) from UV to FIR of exoplanet haze analogs produced using the PAMPRE and COSmIC setups from a mixture of 95% N2–4% CH4–1% CO. The n and k data obtained for the Pluto and Exoplanet 1 analogs produced from different CH4/CO ratios in an N2-dominated gas mixture (see Table 1) are shown. The previous data of Drant et al. (2024) obtained for an exoplanet and/or early Earth haze analog produced with 95% N2–4% CH4–1% CO2 is also plotted to compare the effect of CO vs. CO2 on the refractive indices of the solid haze analog material. |
5.5 Refractive indices of exoplanet hydrocarbon haze analogs
Fig. 13 shows the refractive indices from UV to FIR of the Exoplanet 2 and 3 haze analogs produced without nitrogen using different gas relative abundances CH4/CO (see Table 1) with the PAMPRE and COSmIC setups. We find that the UV-visible k values of the PAMPRE Exoplanet 2 and 3 analogs are significantly lower compared to the haze analogs produced in N2-dominated gas mixtures, i.e., compared to the PAMPRE Titan, Pluto and Exoplanet 1 haze analogs (Fig. 13, middle panel). The lack of nitrogen in the solid analog can explain these lower UV-visible k values and the shift of the bandgap energy toward higher energies (shorter wavelengths) since the electronic transitions of these PAMPRE Exoplanet 2 and 3 analogs are now solely attributed to methyl functional groups, without the contribution from amine functional groups. The difference between the UV-visible k values of the PAMPRE Exoplanet 2 and Titan 2 analogs confirm our previous interpretation that the incorporation of nitrogen increases absorption properties in the UV-visible range (Figs. 9 and 13, middle panels). In addition, the n values of the PAMPRE Exoplanet 2 and 3 analogs are lower than the n values obtained on the PAMPRE Titan, Pluto and Exoplanet 1 analogs (Fig. 13, top panel), which suggest that the absence of nitrogen in the solid sample also leads to a decrease in n. Sciamma-O’Brien et al. (2023) reported a similar behavior between their Titan analogs and their analog produced without nitrogen.
The spectral variations in n in the IR are small for the PAMPRE and COSmIC Exoplanet 2 and 3 analogs (Fig. 13, top panel). This is explained by the weaker MIR features of these analogs compared to the analogs produced in N2-dominated gas mixtures (see Fig. 13, middle & bottom panels). The important variations in n in the IR are mainly caused by the strong C=C and C=N resonances around 6 μm in the Titan, Pluto, and Exoplanet 1 analogs (Figs. 9, 11, and 12). The alkene and/or aromatic C=C features are observed on the COSmIC Exoplanet 2 and 3 analogs but their k values are lower than those observed on the COSmIC Titan, Pluto, and Exoplanet 1 analogs. These C=C features are, however, not observed on the PAMPRE Exoplanet 2 and 3 analogs. In addition, a large feature at 3 μm is observed on the COSmIC Exoplanet 2 and 3 analogs but not on the PAMPRE analogs. This feature is likely attributed to −C≡C-H, although the possibility of it being caused by O−H cannot be ruled out based on our current data. The MIR absorption properties of the PAMPRE Exoplanet 2 and 3 analogs are dominated by alkane and/or aliphatic CH2, 3 stretching (3.4–3.7 μm) and bending (≈ 6.7–7.2 μm) modes. These C-H features are also observed on the COSmIC Exoplanet 2 and 3 analogs although they are stronger for the PAMPRE analogs (higher k values) between 3.4 and 3.7 μm (Fig. 13, middle & bottom panels). The differences in MIR features between the PAMPRE and COSmIC Exoplanet 2 and 3 analogs strongly suggest a difference in the solid composition despite the similar initial gas composition. It seems that the COSmIC Exoplanet 2 and 3 analogs contain more aromatic and/or alkene compounds than the PAMPRE analogs produced with similar gas compositions.
The comparison of the Exoplanet 2 and Exoplanet 3 haze analogs further supports our previous interpretation that the refractive indices are poorly sensitive to changes in the gas relative abundance CH4/CO. The slope of k in the UV-visible is indeed similar for both PAMPRE analogs (Fig. 13, middle panel). The comparison of haze refractive indices between the COSmIC and PAMPRE analogs once again reveals strong variations, with higher UV-visible k values for the COSmIC analogs. These data obtained on haze analogs produced without nitrogen suggest that the difference in UV-visible k values reported in Figs. 9, 11, and 12 is not only attributed to a change in nitrogen incorporation but also likely caused by stronger methyl electronic transitions in the COSmIC analogs compared to the PAMPRE analogs.
These new state-of-the-art data presented in Fig. 13 reveal that photochemical hazes produced in N-poor environments exhibit very different optical properties in the entire spectral range from UV to FIR compared to hazes produced in N-rich environments. We emphasize that the refractive indices of these hydrocarbon hazes produced at low temperature via photochemistry are significantly different from the refractive indices of soot material (Lavvas & Arfaux (2021) and references therein), which are generally more absorbing in the entire spectral range. These new data should be used to consider the radiative impact of hazes in the N-poor stratosphere of Solar System gas giants (e.g., Guerlet et al. 2020) and the detectability of haze features in sub-Neptune exoplanet atmospheres (e.g., Gao et al. 2023 and He et al. 2024). As suggested by the study of Khare et al. (1987), the strength of the C−H IR features and the UV-visible absorption slope may be different in H2-dominated gas mixtures, which will be the focus of future work.
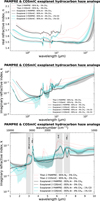 |
Fig. 13 Refractive indices n (top) and k (middle and bottom) from UV to FIR of hydrocarbon exoplanet haze analogs produced without nitrogen with the PAMPRE and COSmIC setups. Data for the Exoplanet 2 and Exoplanet 3 analogs produced from different gas relative abundances CH4/CO (see Table 1) are shown. |
5.6 Influence of the refractive indices on the radiative properties of haze particles
The refractive indices of laboratory-generated haze analogs are used as input in light scattering models to consider the influence of the solid chemical composition and derive the optical properties of spherical and/or aggregate particles observed in planetary atmospheres and surfaces. We performed calculations using the refractive indices of the COSmIC Titan 2, PAMPRE Titan 2, and PAMPRE Exoplanet 2 analogs, which exhibit very different n and k values from UV to FIR. The extinction efficiency (Qext), single-scattering albedo (SSA), and asymmetry parameter (g) of haze particles with a similar composition and thus similar refractive indices to our analogs are shown in Fig. 14. We consider simple spherical particles (solid curves, Fig. 14) and fractal aggregates of spherical monomers (dashed curves, Fig. 14) since both are expected to be present at different altitudes in planetary atmospheres and their optical properties are known to differ significantly (e.g., Adams et al. (2019)). Our calculations for spherical haze particles follow the theory of Wiscombe (1979) (open-source miepython Python package2). We further verified the results with the LX-MIE model3, described in Kitzmann & Heng (2018), which uses a slightly different numerical procedure. We determined the optical properties of spherical particles with a radius of 50 nm(± 10%) guided by observational constraints on the size of Titan aerosols (e.g., Tomasko et al. (2008) and Tomasko et al. 2009). Since photochemical hazes are also known to evolve as fractal aggregates (e.g., West & Smith 1991, Cabane et al. 1992 and Lavvas et al. 2008), we performed additional calculations following the Mean-Field approximation for scattering by fractal aggregates of identical Mie spheres, first described in Botet et al. (1997), to emphasize the difference in optical properties compared to simple spherical particles. We used an improved version of the model (MFT-M+, Rannou et al. 2024) that accounts for a correction in the limit of the geometrical optics, presented in Tazaki & Tanaka (2018) on the one hand, and for the effect of monomer adjacency in the correlation pair function, presented in Rannou et al. (2024) on the other hand. The input parameters used, i.e., the particle fractal dimension (Df), the number of monomers (Nm), and the monomer radius (rm), are chosen following previous analyses of Titan and exoplanet observations. For a first Titan-like particle morphology, we used Df=2, Nm = 3000, and rm=50 nm using constraints from Titan observations (Tomasko et al. 2008, 2009). For a second particle morphology more representative of exoplanet hazes, we considered three million monomers with a 5 nm radius, still with a Df of 2, following Adams et al. (2019) and Lavvas & Koskinen (2017). In Fig. 14, we used the Titan-like haze morphology for the three different haze analog refractive indices (red, green, and blue curves), and we used the second exoplanet morphology only for the PAMPRE Exoplanet 2 analog (gray curve).
Fig. 14 shows that the extinction efficiency is strongly influenced by the refractive indices and by the aerosol morphology in the entire spectral range from UV to FIR. The single-scattering albedo, which controls the fraction of light scattered by aerosols, is also very sensitive to the refractive indices, while the asymmetry parameter, which reflects the angular distribution of the scattered light, is rather insensitive to the refractive indices but very sensitive to the particle morphology. Fig. 14 emphasizes that the optical properties of exoplanet hazes are significantly different because of the change in refractive indices but also because of the change in morphology.
The variations in the UV-visible extinction slope, combined with the variation in the single scattering albedo, suggest that the composition of the haze particles will significantly influence the planetary albedo and the atmospheric heating-cooling properties. This will directly control the absorption and transmission of diffuse light through the hazy atmosphere. These differences will likely lead to significant variations in the temperature in the upper region of the atmosphere, which is probed during spectroscopic exoplanet observations (e.g., Steinrueck et al. (2023)).
Fig. 14 also shows that the MIR absorption features of hazes significantly impact the extinction efficiency and may therefore be used to infer the presence of hazes and constrain other atmospheric properties from JWST observations, as proposed by He et al. (2024). Given the transparency of N2 in the spectral range of JWST, the differences in the MIR haze features shown in Fig. 14 may help constrain the presence or absence of nitrogen in the atmospheres of exoplanets, for instance, using the different N−H (3.1–3.3 μm), −C ≡ N/−N≡C (4.4–4.7 μm) and C=N (6.1–6.6 μm) solid features.
Recent work revealed that the addition of sulfur in the gas mixture increases the haze production rate (He et al. 2020; Reed et al. 2022) leading to solid analogs with a composition rich in sulfur (Vuitton et al. 2021) and higher n and k values at visible wavelengths (Reed et al. 2023). On the other hand, a gas mixture rich in sulfur and CO2, as expected for the atmosphere of early-Earth, would produce hazes with lower absorption properties at visible wavelengths likely caused by a solid composition richer in inorganic salts (Jansen et al. 2025). These recent studies emphasize the need for additional experimental measurements to understand the influence of different gasses on the optical properties of hazes in a broad spectral range.
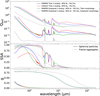 |
Fig. 14 Radiative properties, including extinction efficiency, single-scattering albedo, and asymmetry of haze particles, using the refractive indices derived on PAMPRE and COSmIC Titan and Exoplanet haze analogs. The calculations account for the simple spherical particles (solid curves) and fractal aggregates of spherical monomers (dashed curves) expected in hazy planetary atmospheres. Two different morphologies are shown. A first morphology similar to Titan hazes is considered with Df=2, Nm=3000, and rm=50 nm for the three different haze analogs shown (blue, red, and green curves). A second morphology representing exoplanet hazes is shown (gray curves) only for the PAMPRE Exoplanet 2 analog using Df=2, Nm=3 × 10⁶, and rm= 5 nm. The extinction efficiency here is defined by the extinction cross section divided by the surface area of the sphere of equivalent volume. |
6 Conclusions
In the present work, we derived the refractive indices from UV to FIR (up to 200 μm) of Titan, Pluto, and exoplanet haze analogs produced with various gas compositions and two different experimental setups, namely PAMPRE at LATMOS (France) and COSmIC at the NASA Ames Research Center (USA). Using different approaches to determine the refractive indices, we found that the Cauchy analytical functions are more reliable than the Tauc–Lorentz physical description for retrieving accurate n and k values in the UV-visible-NIR. We report strong agreement between the refractive indices determined by ellipsometry and spectroscopy. Discrepancies in the n and k values determined with both techniques arise when the samples weakly absorb, mainly in the NIR spectral range, as the retrieval of low k values becomes very sensitive to measurement biases such as beam focalization.
We report strong differences between the refractive indices of PAMPRE and COSmIC haze analogs, even for those produced from similar gas compositions, which is caused by the variations in the experimental conditions (i.e., gas temperature, pressure, energy of plasma discharge, and gas residence time) influencing the gas-phase haze precursors. Using transmission measurements performed at different temperatures from 40 to 288 K, we confirm that the measurement temperature does not influence the refractive indices of the haze analogs in the mid-IR. The COSmIC analogs generally present higher n and k values in the entire spectral range. Using different gas compositions where we varied the N2/CH4 and CH4/CO abundance ratios in the initial gas mixture, we observed that changes in the gas N2/CH4 ratio strongly influence the k values of the haze analogs in the entire spectral range. On the other hand, a decrease in the gas relative abundance CH4/CO from ∞ to 4 does not affect the refractive indices of the organic analogs significantly. Based on the data reported in previous work, it suggests that CO and CO2 influence the gas chemistry and haze composition differently, which leads to variations in the haze refractive indices. Using analogs produced without any nitrogen, we found that C-H-O haze analogs present refractive indices that are very different from nitrogenous haze analogs. They are generally more transparent with lower n values in the entire spectral range from the UV to the IR. The variations in IR absorption features between hazes produced with and without nitrogen in the gas composition could help constrain the detection of gaseous N2 in exoplanet atmospheres from telescope observations.
For each application that requires the use of haze analog refractive indices, we recommend using both PAMPRE and COSmIC datasets to fully understand and assess the influence of the refractive indices on the outcome, whether they are used for modeling or observations. The large differences in the k values of our different analogs in the UV-visible and IR suggest that the radiative impact of photochemical hazes may change significantly following variations in the haze composition. These new data should be used in future work to reanalyze previous observations of Titan and Pluto’s surface and atmosphere, as well as to reassess the influence of hazes on the cooling and heating properties of the atmosphere. The state-of-the-art refractive index data reported in this work for C-H hazes produced without nitrogen should be used to analyze observations of the Solar System gas giants (e.g., Jupiter) and exoplanet atmospheres (e.g., sub-Neptunes), as well as to assess the impact of the haze composition on the detectability of haze signatures and the resulting degeneracy on retrieved haze properties (e.g., production rate or particle number density) during the analysis of JWST data.
Data availability
The refractive indices data provided in this article are available in the Optical Constants dataBase (OCdB) at https://ocdb.smce.nasa.gov/. They are also available upon request to This email address is being protected from spambots. You need JavaScript enabled to view it. .
Acknowledgements
T.D. acknowledges support by the “ADI 2021” project funded by the IDEX Paris-Saclay (ANR-11-IDEX-0003-02). T.D. thanks the NOMIS Foundation ETH Fellowship Programme and the respective research made possible thanks to the support of the NOMIS Foundation. T.D. thanks the SOLEIL synchrotron for the AILES beamtime provided (proposal ID 20231358 and 20221651). T.D., E.S.-O. and L.M. thank the entire staff at AILES for their support and assistance during the optical experiments. T.D., L.M. and L.V. thank Prof. N. Carrasco and the European Research Council for funding via the ERC OxyPlanets project (grant agreement No. 101053033). E.S.-O., L.J., and C.L.R. acknowledge support from the Internal Scientist Funding Model (ISFM) NASA Ames Laboratory Astrophysics Directed Work Package (22-A22ISFM-0009). E.S.-O., C.L.R., T.L.R., D.H.W. acknowledge support from the Internal Scientist Funding Model (ISFM) NASA Center for Optical Constants.
References
- Adams, D., Gao, P., de Pater, I., & Morley, C. V., 2019, ApJ, 874, 61 [NASA ADS] [CrossRef] [Google Scholar]
- Alcouffe, G., Cavarroc, M., Cernogora, G., et al. 2010, Plasma Sources Sci. Technol., 19, 015008 [Google Scholar]
- Alves, L. L., Marques, L., Pintassilgo, C. D., et al. 2012, Plasma Sources Sci. Technol., 21, 045008 [NASA ADS] [CrossRef] [Google Scholar]
- Arney, G., Domagal-Goldman, S. D., Meadows, V. S., et al. 2016, Astrobiology, 16, 11 [Google Scholar]
- Aspnes, D. E., & Studna, A. A., 1983, Phys. Rev. B, 27, 985 [Google Scholar]
- Atreya, S. K., Wong, A. S., Baines, K. H., Wong, M. H., & Owen, T. C., 2005, Planet. Space Sci., 53, 498 [Google Scholar]
- Baines, K. H., Drossart, P., Momary, T. W., et al. 2005, Earth Moon Planet, 96, 119 [Google Scholar]
- Bellucci, A., Sicardy, B., Drossart, P., et al. 2009, Icarus, 201, 198 [NASA ADS] [CrossRef] [Google Scholar]
- Botet, R., Rannou, P., & Cabane, M., 1997, Appl. Opt., 36, 8791 [NASA ADS] [CrossRef] [Google Scholar]
- Brassé, C., Muñoz, O., Coll, P., & Raulin, F., 2015, Planet. Space Sci., 109, 159 [CrossRef] [Google Scholar]
- Cabane, M., Chassefière, E., & Israel, G., 1992, Icarus, 96, 176 [NASA ADS] [CrossRef] [Google Scholar]
- Campi, D., & Coriasso, C., 1988, Mater. Lett., 7, 134 [Google Scholar]
- Carlson, R. W., Baines, K. H., Anderson, M. S., Filacchione, G., & Simon, A. A., 2016, Icarus, 274, 106 [Google Scholar]
- Carrasco, N., Jomard, F., Vigneron, J., Etcheberry, A., & Cernogora, G., 2016, Planet. Space Sci., 128, 52 [Google Scholar]
- Corrales, L., Gavilan, L., Teal, D. J., & Kempton, E. M.-R., 2023, ApJ, 943, L26 [Google Scholar]
- Courtin, R., Kim, S. J., & Bar-Nun, A., 2015, A&A, 573, A21 [NASA ADS] [CrossRef] [EDP Sciences] [Google Scholar]
- Dodge, M. J., 1984, Appl. Opt., 23, 1980 [NASA ADS] [CrossRef] [Google Scholar]
- Drant, T., Garcia-Caurel, E., Perrin, Z., et al. 2024, A&A, 682, A6 [NASA ADS] [CrossRef] [EDP Sciences] [Google Scholar]
- Drant, T., Tian, M., Carrasco, N., & Heng, K., 2025, A&A, 698, A76 [NASA ADS] [CrossRef] [EDP Sciences] [Google Scholar]
- Dubois, D., Carrasco, N., Jovanovic, L., et al. 2020, Icarus, 338, 113437 [CrossRef] [Google Scholar]
- Edwards, D. F., & Ochoa, E., 1980, Appl. Opt., 19, 4130 [Google Scholar]
- Fayolle, M., Quirico, E., Schmitt, B., et al. 2021, Icarus, 367, 114574 [Google Scholar]
- Fujiwara, H., 2007, Spectroscopic Ellipsometry: Principles and Applications (The Atrium, Southern Gate, Chichester, West Sussex, England: John Wiley & Sons Ltd) [Google Scholar]
- Gao, P., Thorngren, D. P., Lee, E. K. H., et al. 2020, Nat. Astron., 4, 951 [NASA ADS] [CrossRef] [Google Scholar]
- Gao, P., Wakeford, H. R., Moran, S. E., & Parmentier, V., 2021, JGR Planets, 126, 4 [Google Scholar]
- Gao, P., Piette, A. A. A., Steinrueck, M. E., et al. 2023, ApJ, 951, 96 [NASA ADS] [CrossRef] [Google Scholar]
- Gautier, T., Carrasco, N., Buch, A., et al. 2011, Icarus, 213, 625 [NASA ADS] [CrossRef] [Google Scholar]
- Gautier, T., Carrasco, N., Mahjoub, A., et al. 2012, Icarus, 221, 320 [NASA ADS] [CrossRef] [Google Scholar]
- Gautier, T., Serigano, J., Das, K., et al. 2024, A&A, 690, A165 [NASA ADS] [CrossRef] [EDP Sciences] [Google Scholar]
- Gavilan, L., Broch, L., Carrasco, N., Fleury, B., & Vettier, L., 2017, ApJ, 848, L5 [NASA ADS] [CrossRef] [Google Scholar]
- Gavilan, L., Carrasco, N., Hoffmann, S. V., Jones, N. C., & Mason, N. J., 2018, ApJ, 861, 110 [NASA ADS] [CrossRef] [Google Scholar]
- Gavilan Marin, L., Bejaoui, S., Haggmark, M., et al. 2020, ApJ, 889, 101 [NASA ADS] [CrossRef] [Google Scholar]
- Gladstone, G. R., & Young, L. A., 2019, Annu. Rev. Earth Planet. Sci., 47, 119 [Google Scholar]
- Gladstone, G. R., Stern, S. A., Ennico, K., et al. 2016, Science, 351, 6279 [Google Scholar]
- Grundy, W. M., Bertrand, T., Binzel, R. P., et al. 2018, Icarus, 314, 232 [CrossRef] [Google Scholar]
- Guerlet, S., Spiga, A., Delattre, H., & Fouchet, T., 2020, Icarus, 351, 113935 [Google Scholar]
- Harbecke, B., 1986, Appl. Phys. B, 39, 165 [Google Scholar]
- Hasenkopf, C. A., Beaver, M. R., Trainer, M. G., et al. 2010, Icarus, 207, 903 [Google Scholar]
- Hawranek, J. P., Neelakantan, P., Young, R. P., & Jones, R. N., 1976, Spectrochim. Acta, 32, 85 [Google Scholar]
- He, C., Hörst, S. M., Lewis, N. K., et al. 2018, ApJ, 856, L3 [CrossRef] [Google Scholar]
- He, C., Hörst, S. M., Lewis, N. K., et al. 2020, Nat. Astron., 4, 986 [Google Scholar]
- He, C., Hörst, S. M., Radke, M., & Yant, M. 2022a, Planet. Sci. J., 3, 25 [NASA ADS] [CrossRef] [Google Scholar]
- He, C., Serigano, J., Hörst, S. M., Radke, M., & Sebree, J. A. 2022b, ACS Earth Space Chem., 6, 2295 [Google Scholar]
- He, C., Radke, M., Moran, S. E., et al. 2024, Nat. Astron., 8, 182 [Google Scholar]
- Hörst, S. M., 2017, JGR Planets, 122, 432 [Google Scholar]
- Hörst, S. M., & Tolbert, M. A., 2014, ApJ, 781, 53 [Google Scholar]
- Hörst, S. M., Yoon, Y. H., Ugelow, M. S., et al. 2018, Icarus, 301, 136 [CrossRef] [Google Scholar]
- Hu, R., Bello-Arufe, A., Zhang, M., et al. 2024, Nature, 630, 609 [NASA ADS] [CrossRef] [Google Scholar]
- Imanaka, H., Khare, B. N., Elsila, J. E., et al. 2004, Icarus, 168, 344 [NASA ADS] [CrossRef] [Google Scholar]
- Imanaka, H., Cruikshank, D. P., Khare, B. N., & McKay, C. P., 2012, Icarus, 218, 247 [NASA ADS] [CrossRef] [Google Scholar]
- Jansen, K. T., Reed, N. W., Browne, E. C., & Tolbert, M. A., 2025, Astrobiology, 25, 395 [Google Scholar]
- Jellison, G. E., & Modine, F. A., 1996, Appl. Phys. Lett., 69, 371 [NASA ADS] [CrossRef] [Google Scholar]
- Jenkins, F. A., & White, H. E., 1981, Fundamentals of Optics (Auckland: McGraw-Hill), 482 [Google Scholar]
- Jovanovic, L., Gautier, T., Vuitton, V., et al. 2020, Icarus, 346, 113774 [CrossRef] [Google Scholar]
- Jovanovic, L., Gautier, T., Broch, L., et al. 2021, Icarus, 362, 114398 [CrossRef] [Google Scholar]
- Khare, B. N., Sagan, C., Arakawa, E. T., et al. 1984, Icarus, 60, 127 [CrossRef] [Google Scholar]
- Khare, B. N., Sagan, C., Thompson, W. R., Arakawa, E. T., & Votaw, P., 1987, J. Geophys. Res., 92, 15067 [Google Scholar]
- Khare, B. N., Sagan, C., Thompson, W. R., et al. 1994, Can. J. Chem., 72, 678 [Google Scholar]
- Kim, S. J., & Courtin, R., 2013, A&A, 557, L6 [NASA ADS] [CrossRef] [EDP Sciences] [Google Scholar]
- Kim, S. J., Drossart, P., Caldwell, J., et al. 1991, Icarus, 91, 145 [Google Scholar]
- Kim, S. J., Jung, A., Sim, C. K., et al. 2011, Planet. Space Sci., 59, 699 [Google Scholar]
- Kim, S. J., Lee, D. W., Sim, C. K., et al. 2018, JQSRT, 210, 197 [Google Scholar]
- Kitzmann, D., & Heng, K., 2018, MNRAS, 475, 94 [NASA ADS] [CrossRef] [Google Scholar]
- Kramers, M. H. A., 1927, Atti. Cong. Intern. Fisica (Transactions of Volta Centenary Congress) Como, 2, 545 [Google Scholar]
- Krasnopolsky, V. A., 2020, Icarus, 335, 113374 [Google Scholar]
- Kronig, R. de L., 1926, J. Opt. Soc. Am., 12, 547 [NASA ADS] [CrossRef] [Google Scholar]
- Lauer, T. R., Spencer, J. R., Bertrand, T., et al. 2021, Planet. Sci. J., 2, 214 [Google Scholar]
- Lavvas, P., & Arfaux, A., 2021, MNRAS, 502, 5643 [NASA ADS] [CrossRef] [Google Scholar]
- Lavvas, P. P., Coustenis, A., Vardavas, I. M., 2008, Planet. Space Sci., 56, 27 [NASA ADS] [CrossRef] [Google Scholar]
- Lavvas, P., & Koskinen, T., 2017, ApJ, 847, 32 [NASA ADS] [CrossRef] [Google Scholar]
- Lellouch, E., de Bergh, C., Sicardy, B., Käufl, H. U., & Smette, A., 2011, A&A, 530, L4 [NASA ADS] [CrossRef] [EDP Sciences] [Google Scholar]
- Lellouch, E., Gurwell, M., Butler, B., et al. 2017, Icarus, 286, 289 [CrossRef] [Google Scholar]
- Liggins, P., Shorttle, O., & Rimmer, P. B., 2020, EPSL, 550, 116546 [Google Scholar]
- Liggins, P., Jordan, S., Rimmer, P. B., & Shorttle, O., 2023, JGR Planets, 128, 3 [Google Scholar]
- Lora, J. M., Kataria, T., & Gao, P., 2018, ApJ, 853, 58 [NASA ADS] [CrossRef] [Google Scholar]
- Madhusudhan, N., Sarkar, S., Constantinou, S., et al. 2023, ApJ, 956, L13 [NASA ADS] [CrossRef] [Google Scholar]
- Mahjoub, A., Carrasco, N., Dahoo, P.-R., et al. 2012, Icarus, 221, 670 [NASA ADS] [CrossRef] [Google Scholar]
- Mikal-Evans, T., 2022, MNRAS, 510, 980 [Google Scholar]
- Mills, F. P., Moses, J. I., Gao, P., & Tsai, S.-M., 2021, Space Sci. Rev., 217, 43 [Google Scholar]
- Moran, S. E., Hörst, S. M., He, C., et al. 2022, JGR Planets, 127, 1 [Google Scholar]
- Niemann, H. B., Atreya, S. K., Bauer, S. J., et al. 2005, Nature, 438, 779 [Google Scholar]
- Niemann, H. B., Atreya, S. K., Demick, J. E., et al. 2010, JGR Planets, 115, E12 [Google Scholar]
- Nuevo, M., Sciamma-O’Brien, E., Sandford, S. A., et al. 2022, Icarus, 376, 114841 [NASA ADS] [CrossRef] [Google Scholar]
- Ohno, K., & Kawashima, Y., 2020, ApJ, 895, L47 [NASA ADS] [CrossRef] [Google Scholar]
- Ohta, K., & Ishida, H., 1988, Appl. Spectrosc., 42, 952 [NASA ADS] [CrossRef] [Google Scholar]
- Olkin, C. B., Ennico, K., & Spencer, J., 2017, Nat. Astron., 1, 663 [Google Scholar]
- Ortiz, J. L., Moreno, F., & Molina, A., 1996, Icarus, 119, 53 [NASA ADS] [CrossRef] [Google Scholar]
- Perrin, Z., Carrasco, N., Chatain, A., et al. 2021, Processes, 9, 6 [Google Scholar]
- Perrin, Z., Carrasco, N., Gautier, T., et al. 2025, Icarus, 429, 116418 [Google Scholar]
- Protopapa, S., Olkin, C. B., Grundy, W. M., et al. 2020, AJ, 159, 74 [Google Scholar]
- Ramirez, S. I., Coll, P., da Silva, A., et al. 2002, Icarus, 156, 515 [NASA ADS] [CrossRef] [Google Scholar]
- Rannou, P., Cours, T., Le Mouélic, S., et al. 2010, Icarus, 208, 850 [NASA ADS] [CrossRef] [Google Scholar]
- Rannou, P., Coutelier, M., Rey, M., & Vinatier, S., 2022, A&A, 666, A140 [NASA ADS] [CrossRef] [EDP Sciences] [Google Scholar]
- Rannou, P., Botet, R., & Tazaki, R., 2024, Icarus, 424, 116247 [Google Scholar]
- Reed, N. W., Jansen, K. T., Schiffman, Z. R., Tolbert, M. A., & Browne, E. C., 2023, ApJ, 954, L44 [Google Scholar]
- Reed, N. W., Wing, B. A., Tolbert, M. A., & Browne, E. C., 2022, Geophys. Res. Lett., 49, 9 [Google Scholar]
- Salama, F., Sciamma-O’Brien, E., Contreras, C. S., & Bejaoui, S., 2018, in IAU Proc., 13, 364 [Google Scholar]
- Salzberg, C. D., & Villa, J. J., 1957, J. Opt. Soc. Am., 47, 244 [Google Scholar]
- Sánchez-Lavega, A., Irwin, P., & García Muñoz, A. 2023, Astron. Astrophys. Rev., 31, 5 [Google Scholar]
- Sciamma-O’Brien, E., & Salama, F., 2020, ApJ, 905, 45 [Google Scholar]
- Sciamma-O’Brien, E., Dahoo, P.-R., Hadamcik, E., et al. 2012, Icarus, 218, 356 [CrossRef] [Google Scholar]
- Sciamma-O’Brien, E., Ricketts, C. L., & Salama, F., 2014, Icarus, 243, 325 [Google Scholar]
- Sciamma-O’Brien, E., Upton, K. T., & Salama, F., 2017, Icarus, 289, 214 [CrossRef] [Google Scholar]
- Sciamma-O’Brien, E., Roush, T. L., Rannou, P., Dubois, D., & Salama, F., 2023, Planet. Sci. J., 4, 121 [Google Scholar]
- Sciamma-O’Brien, E., Drant, T., & Wogan, N., 2024, Nat. Rev. Chem., 8, 157 [Google Scholar]
- Scipioni, F., White, O., Cook, J. C., et al. 2021, Icarus, 359, 114303 [Google Scholar]
- Shorttle, O., Jordan, S., Nicholls, H., Lichtenberg, T., & Bower, D. J., 2024, ApJ, 962, L8 [NASA ADS] [CrossRef] [Google Scholar]
- Socrates, G., 2001, Infrared and Raman Characteristic Group Frequencies (John Wiley & Sons Ltd) [Google Scholar]
- Steinrueck, M. E., Koskinen, T., Lavvas, P., et al. 2023, ApJ, 951, 117 [NASA ADS] [CrossRef] [Google Scholar]
- Stenzel, O., Hopfe, V., & Klobes, P., 1991, J. Phys. D: Appl. Phys., 24, 2088 [NASA ADS] [CrossRef] [Google Scholar]
- Stern, S. A., Bagenal, F., Ennico, K., et al. 2015, Science, 350, 6258 [Google Scholar]
- Swanepoel, R., 1983, J. Phys. E: Sci. Instrum., 16, 1214 [NASA ADS] [CrossRef] [Google Scholar]
- Szopa, C., Cernogora, G., Boufendi, L., Correia, J. J., & Coll, P., 2006, Planet. Space Sci., 54, 394 [NASA ADS] [CrossRef] [Google Scholar]
- Tauc, J., Grigorovici, R., & Vancu, A., 1966, Phys. Stat. Sol., 15, 627 [CrossRef] [Google Scholar]
- Tazaki, R., & Tanaka, H., 2018, ApJ, 860, 79 [NASA ADS] [CrossRef] [Google Scholar]
- Tian, M., & Heng, K., 2024, ApJ, 963, 157 [NASA ADS] [CrossRef] [Google Scholar]
- Tomasko, M. G., Doose, L., Engel, S., et al. 2008, Planet. Space Sci., 56, 669 [NASA ADS] [CrossRef] [Google Scholar]
- Tomasko, M. G., Doose, L. R., Dafoe, L. E., & See, C., 2009, Icarus, 204, 271 [NASA ADS] [CrossRef] [Google Scholar]
- Trainer, M. G., Pavlov, A. A., Curtis, D. B., et al. 2004a, Astrobiology, 4, 409 [Google Scholar]
- Trainer, M. G., Pavlov, A. A., Jimenez, J. L., et al. 2004b, Geophys. Res. Lett., 31, 17 [Google Scholar]
- Tran, B. N., Joseph, J. C., Ferris, J. P., Persans, P. D., & Chera, J. J., 2003, Icarus, 165, 379 [NASA ADS] [CrossRef] [Google Scholar]
- Ugelow, M. S., Zarzana, K. J., Day, D. A., Jimenez, J. L., & Tolbert, M. A., 2017, Icarus, 294, 1 [Google Scholar]
- Ugelow, M. S., De Haan, D. O., Hörst, S. M., & Tolbert, M. A., 2018, ApJ, 859, L2 [Google Scholar]
- Vinatier, S., Rannou, P., Anderson, C. M., et al. 2012, Icarus, 219, 5 [NASA ADS] [CrossRef] [Google Scholar]
- Vuitton, V., Lavvas, P., Yelle, R. V., et al. 2009, Planet. Space Sci., 57, 1558 [NASA ADS] [CrossRef] [Google Scholar]
- Vuitton, V., Moran, S. E., He, C., et al. 2021, Planet. Sci. J., 2, 2 [Google Scholar]
- Wan, L., Zhang, X., & Bertrand, T., 2021, ApJ, 922, 244 [Google Scholar]
- Wan, L., Zhang, X., & Hofgartner, J. D., 2023, ApJ, 955, 108 [Google Scholar]
- West, R. A., & Smith, P. H., 1991, Icarus, 90, 330 [Google Scholar]
- Wilson, E. H., & Atreya, S. K., 2004, JGR Planets, 109, E6 [Google Scholar]
- Wiscombe, W. J., 1979, University Corporation for Atmospheric Research [Google Scholar]
- Wogan, N. F., Batalha, N. E., Zahnle, K. J., et al. 2024, ApJ, 963, L7 [NASA ADS] [CrossRef] [Google Scholar]
- Wong, A., Yung, Y. L., & Friedson, A. J., 2003, Geophys. Res. Lett., 30, 8 [NASA ADS] [Google Scholar]
- Zhang, X., Strobel, D. F., & Imanaka, H., 2017, Nature, 551, 352 [NASA ADS] [CrossRef] [Google Scholar]
Appendix A Transmission spectra of the different PAMPRE haze analogs from UV to near-IR
Transmission spectroscopy was used to characterize the optical properties of the PAMPRE haze analogs from UV to near-IR, up to 2.5 μm (see Sect. 3.1). Fig. A.1 presents the transmission spectra of the four other PAMPRE analogs (Titan 2, Pluto, Exoplanet 1, Exoplanet 3) not shown in Fig. 2. The analysis with the Swanepoel method is also shown with the constructed envelopes used for the calculations. Table A.1 presents the film thicknesses of each analog derived during the data analysis. We performed measurements at different positions on each analog sample to derive an uncertainty on the refractive indices. Table A.1 confirms that the thickness of the PAMPRE analog samples is generally homogeneous and does not vary significantly between the different positions. Fig. A.2 presents the determination of n and k with the Swanepoel method for the PAMPRE Titan 2 haze analog.
Film thicknesses derived for each PAMPRE analog sample from UV to near-IR using the transmission data.
Film thicknesses determined for each COSmIC haze analog from the reflection spectra obtained in the UV-Visible-NIR spectral range.
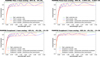 |
Fig. A.1 Transmission spectra obtained for the different PAMPRE haze analogs from UV to near-IR. For the Exoplanet 3 analog, the absorption slope in the UV-visible is shifted toward shorter wavelengths compared to the other analogs, indicating that this nitrogen-free sample is more transparent in that spectral range |
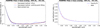 |
Fig. A.2 Determination of the refractive indices with the Swanepoel method for the PAMPRE Titan 2 haze analog. The point-by-point fitting approach (left) shows small variations in k in the visible-NIR and reflects the propagation of uncertainties on n and the film thickness into the calculation of k. For n, a value can be derived for each fringe extremum (red points), and the different data points are subsequently fit with a Cauchy function to obtain a continuous spectrum in the entire range from UV to near-IR. |
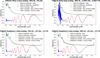 |
Fig. A.3 Reflection spectra obtained for the different COSmIC haze analogs from UV to near-IR. The measured spectra are directly fit to a theoretical model with Cauchy and Tauc–Lorentz equations for the refractive indices. |
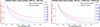 |
Fig. A.4 Refractive indices n and k derived from the UV-Visible-NIR reflection spectra for the COSmIC Titan 1 haze analog (left) and COSmIC Pluto haze analog (right). The results obtained with both Cauchy and Tauc–Lorentz functions are shown. |
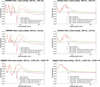 |
Fig. A.5 Transmission spectra obtained for the different PAMPRE and COSmIC haze analogs from near-IR to far-IR. The data are analyzed using the iterative model with an SSKK loop to ensure a physical correlation between n and k. The first step presents a simulation considering the film thickness and a real refractive index constant in the entire IR range (black curve). The second step accounts for variations in n in the IR after calculation with the SSKK model (orange curve). The final step presents the complete fit to the data with n and k correlated by the SSKK model (red curve). |
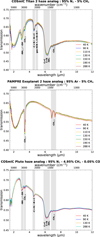 |
Fig. A.6 Transmission spectra obtained in the mid-IR at low temperature with the cryostat setup for a few PAMPRE and COSmIC haze analogs. |
Appendix B Reflection spectra of the different COSmIC haze analogs from UV to near-IR
Reflection measurements, at normal incidence and with high spatial resolution, were performed on the COSmIC haze analogs from visible to near-IR, up to 1.67 μm (see Sect. 3.2). Fig. A.3 presents the reflection spectra for the COSmIC haze analogs (Titan 2, Pluto, Exoplanet 1, Exoplanet 3) not shown in Fig. 3. The spectra are fit with a theoretical model (see Sect. 4.3) using the Cauchy and Tauc–Lorentz equations to express the refractive indices (see Fig. A.3). The film thicknesses determined on each analog during the fit are shown in Table A.2. Since several spectra were obtained at different positions on each sample, Table A.2 confirms a more significant variability of thickness across the surface of the COSmIC analogs compared to the PAMPRE analogs. Fig. A.4 presents the refractive indices determined for the COSmIC Titan 1 and COSmIC Pluto haze analogs with both Cauchy and Tauc–Lorentz equations. The results show that the Tauc–Lorentz model is often unable to constrain positive values of k in the NIR. Both descriptions however provide reliable k values in the region of strong absorption (i.e., in the visible). The assumption of k=0 below the bandgap energy in the Tauc–Lorentz description also leads to overestimations of n (see Fig. A.4) as discussed in Sect. 5.1.
Appendix C Transmission spectra of the different PAMPRE and COSmIC haze analogs from near-IR to far-IR
We performed transmission measurement from near-IR to far-IR (1.5–200 μm) using the Bruker IFS125HR Fourier-Transform IR (FTIR) spectrometer at the Ailes beamline of synchrotron SOLEIL (see Sect. 3.4). Fig. A.5 presents the transmission spectra acquired on all the PAMPRE and COSmIC haze analogs. It also shows the analysis with the iterative model, using singly subtractive Kramers–Kronig calculations, detailed in the Sect. 4.5. Additional measurements were performed at low temperature using a cryostat setup (details in Sect. 3.4). The measurements were performed on the COSmIC Titan 2 analog, PAMPRE Titan 2 analog, COSmIC Pluto analog and PAMPRE Exoplanet 2 analog. The spectra acquired from 40 K to 288 K are shown in Fig. A.6 for the analogs not shown in Fig. 6. For the COSmIC Pluto haze analog, fewer spectra were acquired since these experiments are expensive in time.
All Tables
Summary of the different haze analogs produced with the PAMPRE and COSmIC setups using different gas compositions.
Film thicknesses derived for each PAMPRE analog sample from UV to near-IR using the transmission data.
Film thicknesses determined for each COSmIC haze analog from the reflection spectra obtained in the UV-Visible-NIR spectral range.
All Figures
|
Fig. 1 Images of the Titan haze analogs produced with the PAMPRE (top) and COSmIC (bottom) setups from a mixture of 95% N2 and 5% CH4. The analog organic material is deposited onto MgF2 windows and silicon wafers. |
| In the text | |
|
Fig. 2 Transmission spectra obtained on the Titan 1 and Exoplanet 2 PAMPRE haze analogs (see Table 1) from 0.3 to 2.5 μm. Top: data and analysis using the Swanepoel method for the Titan 1 sample produced from a gas mixture of 90% N2 and 10% CH4. Bottom: data and best fit using Cauchy and Tauc–Lorentz dispersion laws for the Exoplanet 2 analog produced from 95% Ar and 5% CH4 in the initial gas mixture. |
| In the text | |
|
Fig. 3 Reflection spectra obtained on the Titan 1 and Exoplanet 2 COSmIC haze analogs (see Table 1) from ≈ 0.4 to 1.67 μm. The data are fit with both Tauc–Lorentz and Cauchy functions to determine the refractive indices. |
| In the text | |
|
Fig. 4 Ellipsometric data obtained in reflection configuration for the Titan 1 COSmIC haze analog (top panel) and Exoplanet 2 PAMPRE haze analog (bottom panel). The data are fit to the theoretical model considering both Cauchy and Tauc–Lorentz parameterized functions for the dispersion of the refractive indices. |
| In the text | |
|
Fig. 5 Spectroscopic transmission spectra from 1.5 to 200 μm for the Titan 1 COSmIC haze analog (top) and the Exoplanet 2 PAMPRE haze analog (bottom). The simulated absorption-free transmission assuming a constant real refractive index, n, is shown (black curve). The film thickness is fit to match the observed interference fringes in the NIR. The simulated absorption-free transmission spectrum, now accounting for spectral variations in n in the IR (with SSKK model), is also shown (red curve). |
| In the text | |
|
Fig. 6 NIR-MIR transmission spectra of the Titan 2 PAMPRE haze analog produced from a gas mixture of 95% N2 and 5% CH4 (Table 1). The different spectra were obtained at different temperatures using the cryostat setup (see Sect. 3.4). |
| In the text | |
|
Fig. 7 Schematic summarizing different procedures to determine refractive indices from spectroscopic and ellipsometric data spanning UV to far-IR. The data include transmission (T), reflection (R), and the ellipsometric angles (Δ and Ψ). The values f and s refer to film and substrate, respectively; θi is the angle of incidence on the sample during the measurement; and d refers to the thickness of the film (df) and substrate (ds). SSKK refers to the singly subtractive Kramers–Kronig equation (Eq. (11)) describing the correlation between n and k values. |
| In the text | |
|
Fig. 8 Influence of the measurement technique used on the retrieved refractive indices n and k in the UV-visible and near-IR. Top: comparison between the refractive indices determined by reflection ellipsometry and reflection spectroscopy for the COSmIC Titan 1 analog. Bottom: comparison between the refractive indices determined by reflection ellipsometry, reflection spectroscopy, and transmission spectroscopy for the PAMPRE Titan 2 analog. |
| In the text | |
|
Fig. 9 Refractive indices n (top) and k (middle & bottom) of PAMPRE and COSmIC Titan haze analogs from UV to far-IR. Both the Titan 1 and Titan 2 analogs produced from different gas relative abundances N2/CH4 (see Table 1) are shown. The refractive indices of Khare et al. (1984) obtained for a Titan analog with an initial gas composition similar to our Titan 1 analog are also plotted for comparison. The attribution of IR resonances is shown on the bottom panel. |
| In the text | |
|
Fig. 10 Correlation between the N/C ratio of the solid haze analog and the imaginary refractive index k. The trend is shown at different wavelengths relevant to nitrogen absorption (visible wavelengths, N–H at 3 μm and C=N at 6.45 μm). |
| In the text | |
|
Fig. 11 Refractive indices n (top) and k (middle & bottom) of PAMPRE and COSmIC Pluto haze analogs from UV to far-IR (up to 200 μm). The n and k values of the Titan 2 haze analogs produced from a similar gas relative abundance N2/CH4 (see Table 1) are shown for comparison. |
| In the text | |
|
Fig. 12 Refractive indices n (top) and k (middle & bottom) from UV to FIR of exoplanet haze analogs produced using the PAMPRE and COSmIC setups from a mixture of 95% N2–4% CH4–1% CO. The n and k data obtained for the Pluto and Exoplanet 1 analogs produced from different CH4/CO ratios in an N2-dominated gas mixture (see Table 1) are shown. The previous data of Drant et al. (2024) obtained for an exoplanet and/or early Earth haze analog produced with 95% N2–4% CH4–1% CO2 is also plotted to compare the effect of CO vs. CO2 on the refractive indices of the solid haze analog material. |
| In the text | |
|
Fig. 13 Refractive indices n (top) and k (middle and bottom) from UV to FIR of hydrocarbon exoplanet haze analogs produced without nitrogen with the PAMPRE and COSmIC setups. Data for the Exoplanet 2 and Exoplanet 3 analogs produced from different gas relative abundances CH4/CO (see Table 1) are shown. |
| In the text | |
|
Fig. 14 Radiative properties, including extinction efficiency, single-scattering albedo, and asymmetry of haze particles, using the refractive indices derived on PAMPRE and COSmIC Titan and Exoplanet haze analogs. The calculations account for the simple spherical particles (solid curves) and fractal aggregates of spherical monomers (dashed curves) expected in hazy planetary atmospheres. Two different morphologies are shown. A first morphology similar to Titan hazes is considered with Df=2, Nm=3000, and rm=50 nm for the three different haze analogs shown (blue, red, and green curves). A second morphology representing exoplanet hazes is shown (gray curves) only for the PAMPRE Exoplanet 2 analog using Df=2, Nm=3 × 10⁶, and rm= 5 nm. The extinction efficiency here is defined by the extinction cross section divided by the surface area of the sphere of equivalent volume. |
| In the text | |
|
Fig. A.1 Transmission spectra obtained for the different PAMPRE haze analogs from UV to near-IR. For the Exoplanet 3 analog, the absorption slope in the UV-visible is shifted toward shorter wavelengths compared to the other analogs, indicating that this nitrogen-free sample is more transparent in that spectral range |
| In the text | |
|
Fig. A.2 Determination of the refractive indices with the Swanepoel method for the PAMPRE Titan 2 haze analog. The point-by-point fitting approach (left) shows small variations in k in the visible-NIR and reflects the propagation of uncertainties on n and the film thickness into the calculation of k. For n, a value can be derived for each fringe extremum (red points), and the different data points are subsequently fit with a Cauchy function to obtain a continuous spectrum in the entire range from UV to near-IR. |
| In the text | |
|
Fig. A.3 Reflection spectra obtained for the different COSmIC haze analogs from UV to near-IR. The measured spectra are directly fit to a theoretical model with Cauchy and Tauc–Lorentz equations for the refractive indices. |
| In the text | |
|
Fig. A.4 Refractive indices n and k derived from the UV-Visible-NIR reflection spectra for the COSmIC Titan 1 haze analog (left) and COSmIC Pluto haze analog (right). The results obtained with both Cauchy and Tauc–Lorentz functions are shown. |
| In the text | |
|
Fig. A.5 Transmission spectra obtained for the different PAMPRE and COSmIC haze analogs from near-IR to far-IR. The data are analyzed using the iterative model with an SSKK loop to ensure a physical correlation between n and k. The first step presents a simulation considering the film thickness and a real refractive index constant in the entire IR range (black curve). The second step accounts for variations in n in the IR after calculation with the SSKK model (orange curve). The final step presents the complete fit to the data with n and k correlated by the SSKK model (red curve). |
| In the text | |
|
Fig. A.6 Transmission spectra obtained in the mid-IR at low temperature with the cryostat setup for a few PAMPRE and COSmIC haze analogs. |
| In the text | |
Current usage metrics show cumulative count of Article Views (full-text article views including HTML views, PDF and ePub downloads, according to the available data) and Abstracts Views on Vision4Press platform.
Data correspond to usage on the plateform after 2015. The current usage metrics is available 48-96 hours after online publication and is updated daily on week days.
Initial download of the metrics may take a while.