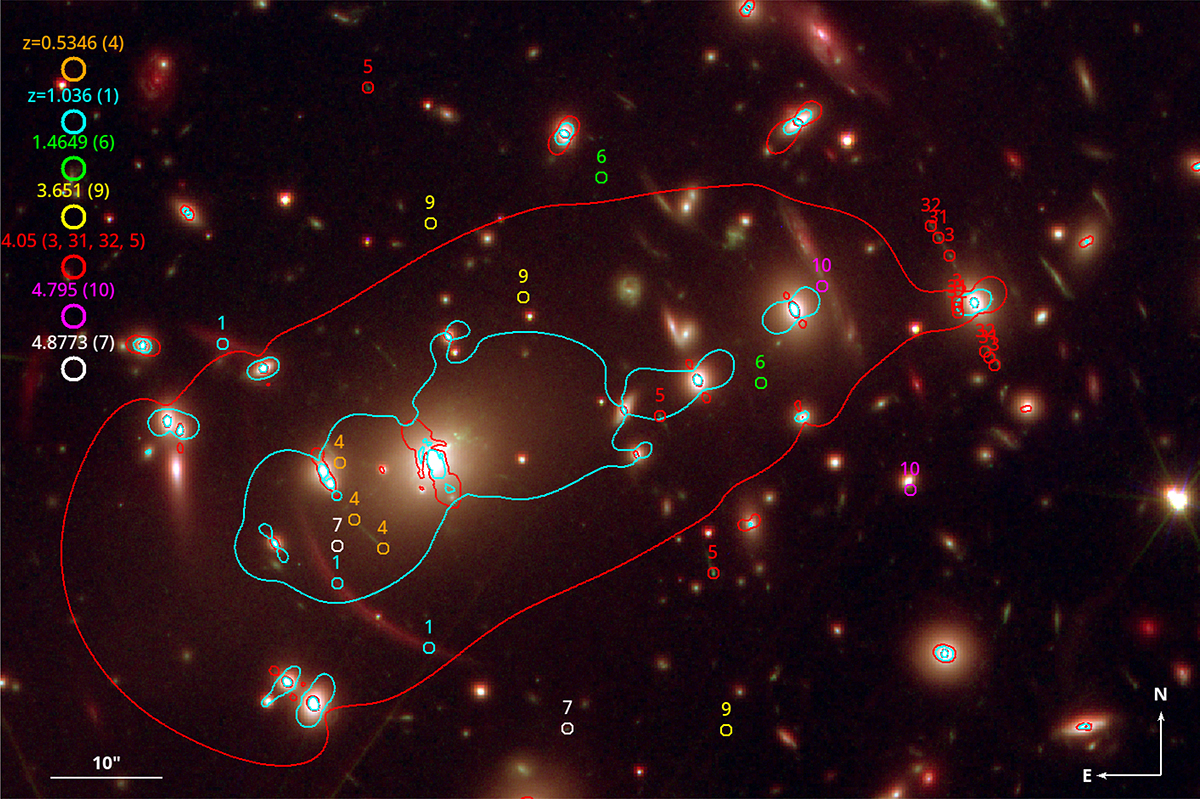
Fig. 1.
Download original image
Colour composite image (Red = NISP JE + YE + HE, Green = HST-ACS-F850LP, Blue = VIS IE) of the central region of A2390. The circles mark the position of the spectroscopic sample of SL constraints from Richard et al. (2008, 2021) colour coded by their spectroscopic redshift (indicated in the upper left). The number next to each small circle is the ID for each family of counterimages. We show the critical curves from the SL + WL model in cyan at zs = 1.036 and red at zs = 4.05. The image covers ![]() .
.
Current usage metrics show cumulative count of Article Views (full-text article views including HTML views, PDF and ePub downloads, according to the available data) and Abstracts Views on Vision4Press platform.
Data correspond to usage on the plateform after 2015. The current usage metrics is available 48-96 hours after online publication and is updated daily on week days.
Initial download of the metrics may take a while.