Fig. 2.
Download original image
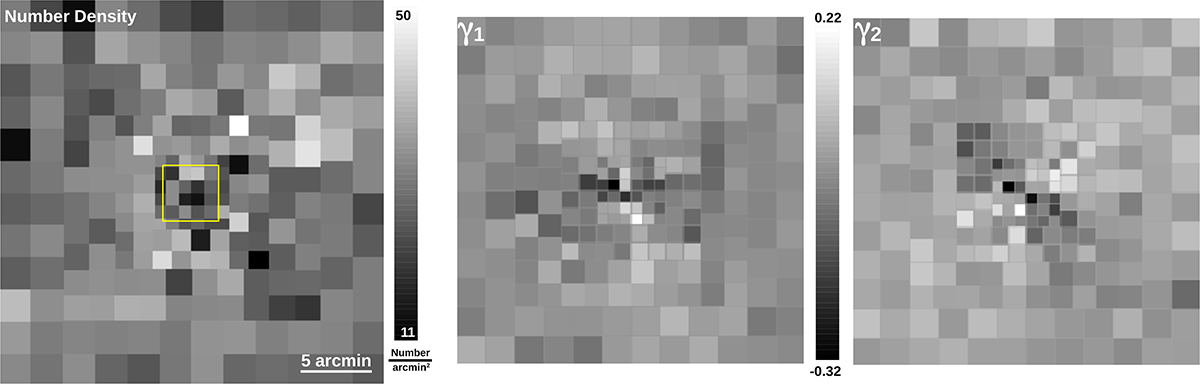
Multi-scale grid used for binning the shear measurements in the clean catalogue. The grid is centred on the cluster. Left: Number of galaxies per square arcminute in each bin when only considering galaxies in the tomographic bins 3–10 described in Schrabback et al. (2025). The smallest bins in the centre are approximately 1′ × 1′ while at the edges the bins are ![]() . The full area is
. The full area is ![]() . A similar grid configuration is adopted for the Gaussian functions in the distribution in mass. For the mass grid, the central 4′×4′ region (where the strong lensing constraints are found) is marked with a yellow square. This small region is further divided with an additional set of 123 smaller Gaussians (not shown). Middle and right: Observed shear γ1 and γ2 in the same multi-scale grid, same field of view, and for LensMC. The classic structure of γ1 and γ2 can be seen (i.e. horizontal and π/4-oriented quadrupole).
. A similar grid configuration is adopted for the Gaussian functions in the distribution in mass. For the mass grid, the central 4′×4′ region (where the strong lensing constraints are found) is marked with a yellow square. This small region is further divided with an additional set of 123 smaller Gaussians (not shown). Middle and right: Observed shear γ1 and γ2 in the same multi-scale grid, same field of view, and for LensMC. The classic structure of γ1 and γ2 can be seen (i.e. horizontal and π/4-oriented quadrupole).
Current usage metrics show cumulative count of Article Views (full-text article views including HTML views, PDF and ePub downloads, according to the available data) and Abstracts Views on Vision4Press platform.
Data correspond to usage on the plateform after 2015. The current usage metrics is available 48-96 hours after online publication and is updated daily on week days.
Initial download of the metrics may take a while.